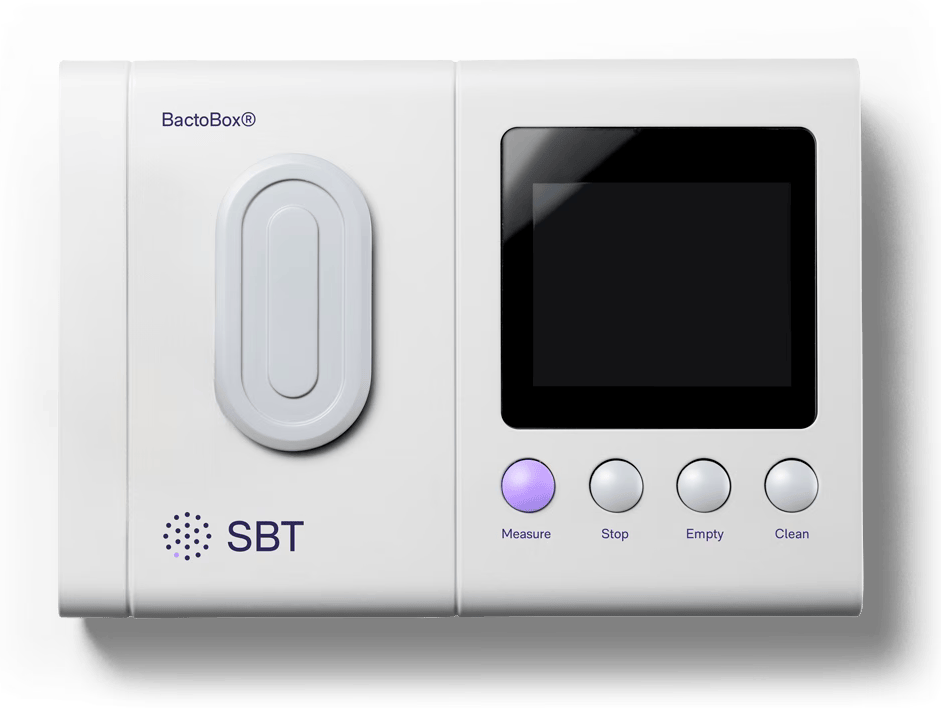
The problem
Decisions made on
incomplete information
Critical process decisions become guesswork when you infer growth from proxy methods, including optical density.
Growth phases are misread. Process comparisons lose clarity. Transfer timing, harvest points, and process behaviour is harder to judge — and harder to improve.
Use cases
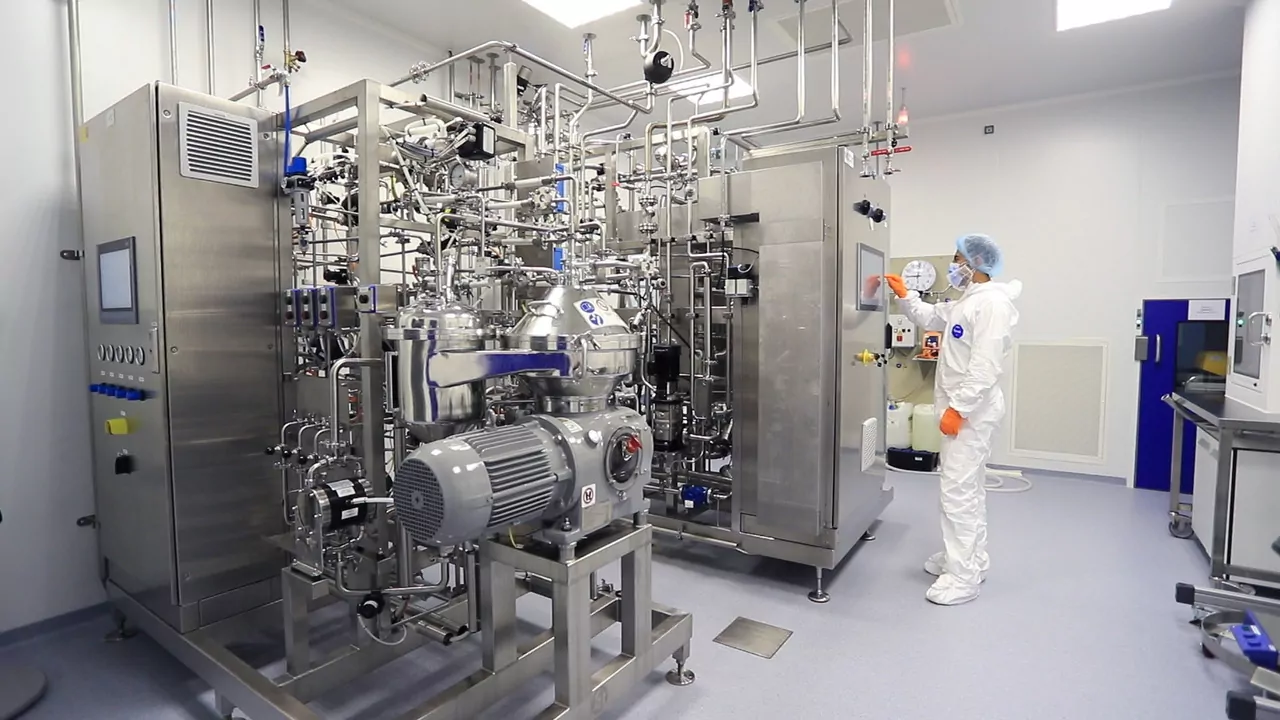
Built for microbial process development
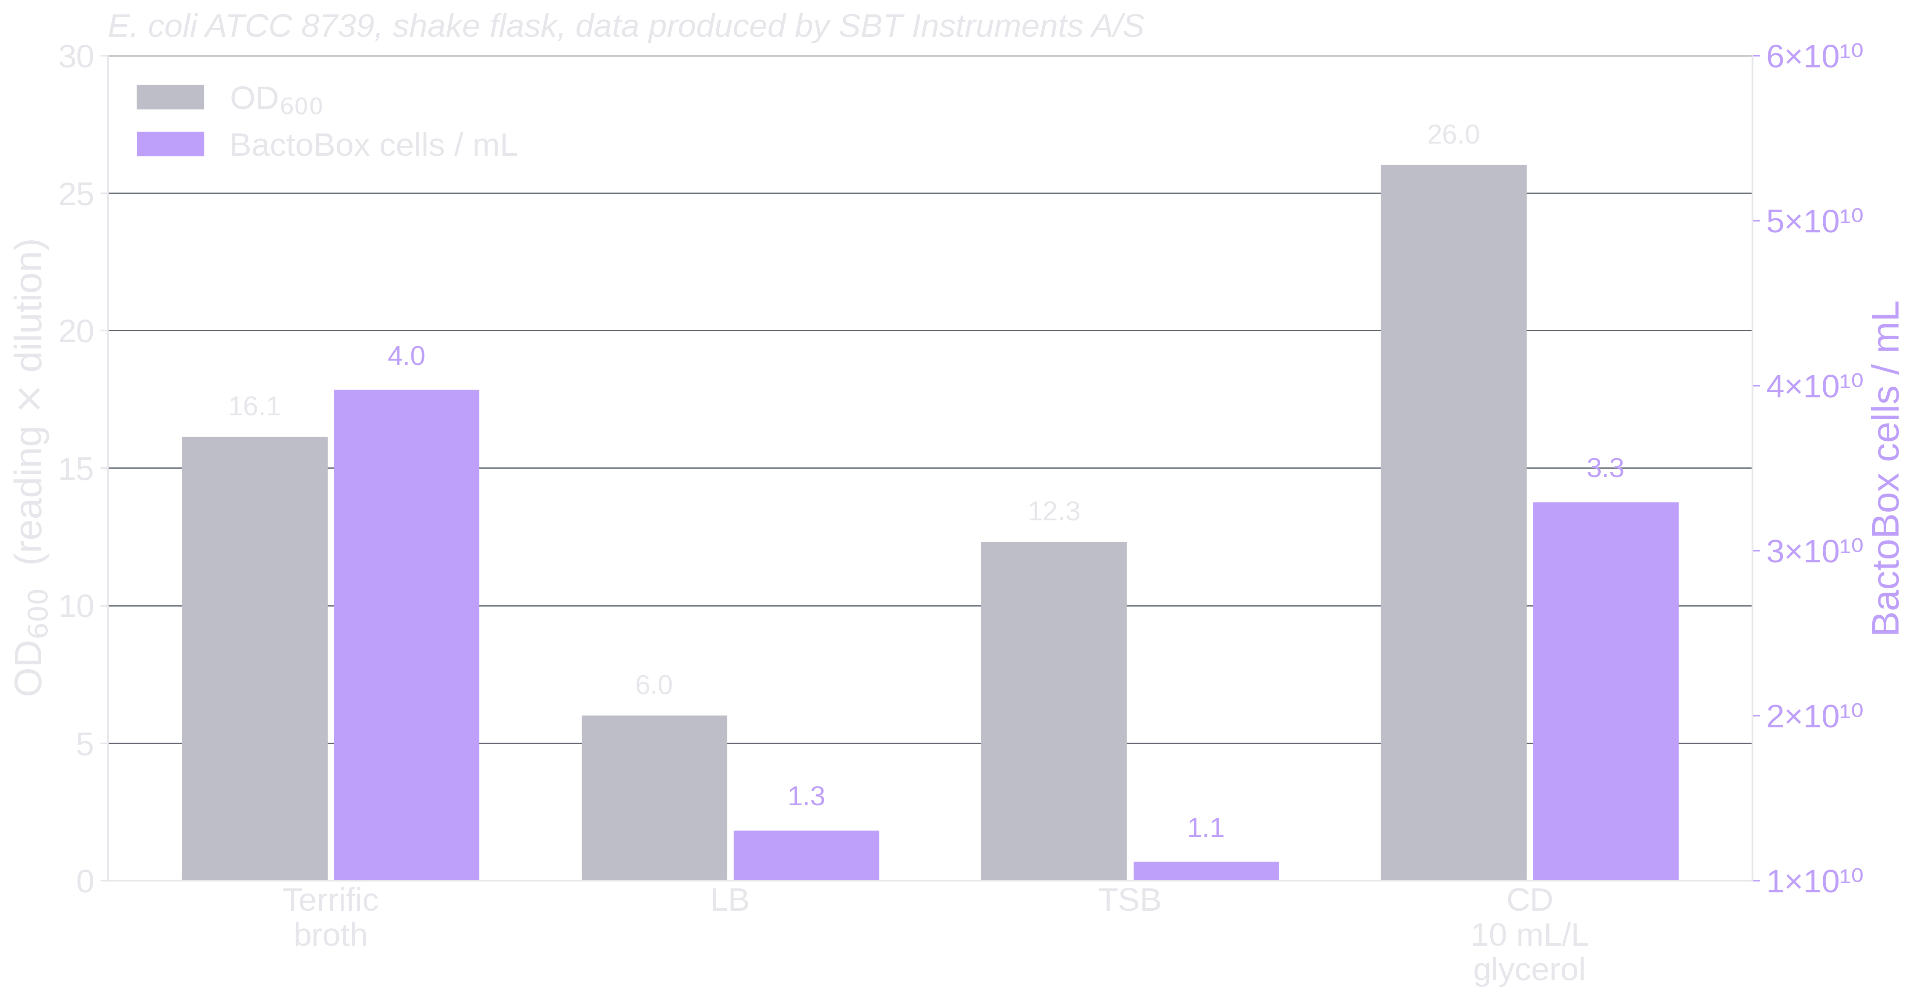
Media screening and process optimization
Compare process conditions based on real growth.
Transfer and harvest timing
See exactly when your culture reaches the right growth phase.
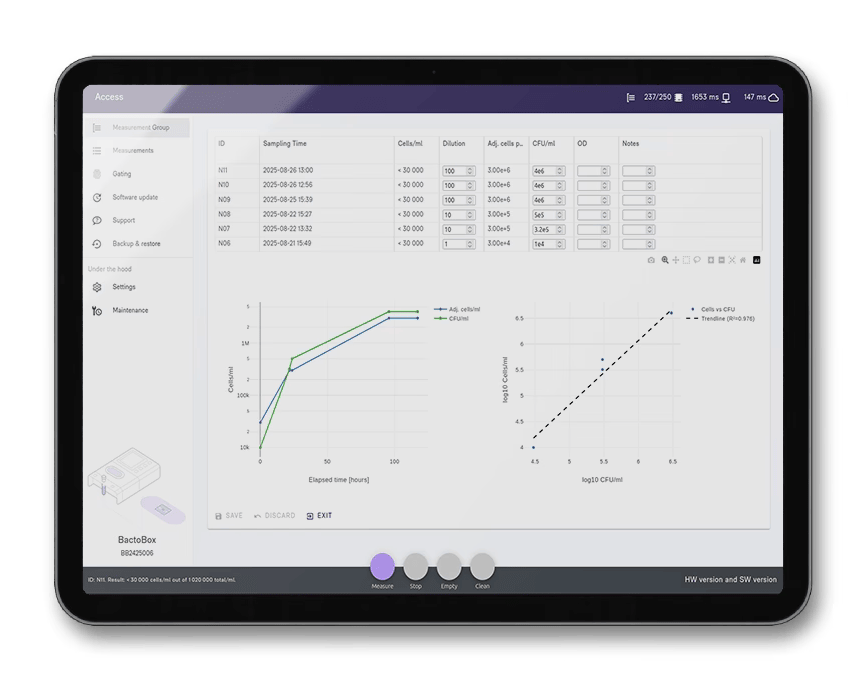
Growth dynamics
Resolve precise growth dynamics across process conditions with true kinetics data.
Knowledge Bridge
Insights from the field and the lab
Knowledge
Picking the optimal medium
How direct cell counts reveal the medium that produces the most cells
Customer Story
Truthworthy growth kinetics for Mycoplasma
September 2025
Customer Story
Leading CDMO accelerates process development with BactoBox®
June 2025

Knowledge
Improving harvest decisions
How a direct cell count compared with CFU sharpens the harvest decision