THE PROBLEM
Change a process condition, and optical density means something else
- Medium
- Temperature
- pH
- Feed rate
- Induction
- Scale
- Strain
Example: across four media, the medium with the highest optical density does not have the most cells.
OD600
- CD medium19.6
- Terrific broth13.3
- TSB11.1
- LB4.9
cells/mL
- CD medium3.2 × 1010
- Terrific broth3.7 × 1010
- TSB1.0 × 1010
- LB1.3 × 1010
E. coli, shake flasks, read at 28 h. SBT Instruments data.
THE SOLUTION
Measure cells/mL directly
1Take a sample
From flask or bioreactor
2Dilute into range
Ready-made dilution vials
3Measure
About two minutes
Decisions that get sharper
Media screening
Rank media and carbon sources on cells, not turbidity.
Harvest timing
See when cell division actually stops.
Induction points
Induce on a cell count and cell state that carries across media and scale.
End of fermentation
Read cells against CFU to see if the process has headroom.
Slow growers
Follow Mycoplasma and other slow organisms without plates.
Cell size
See how the cells are doing, not only how many there are.
It works where OD cannot
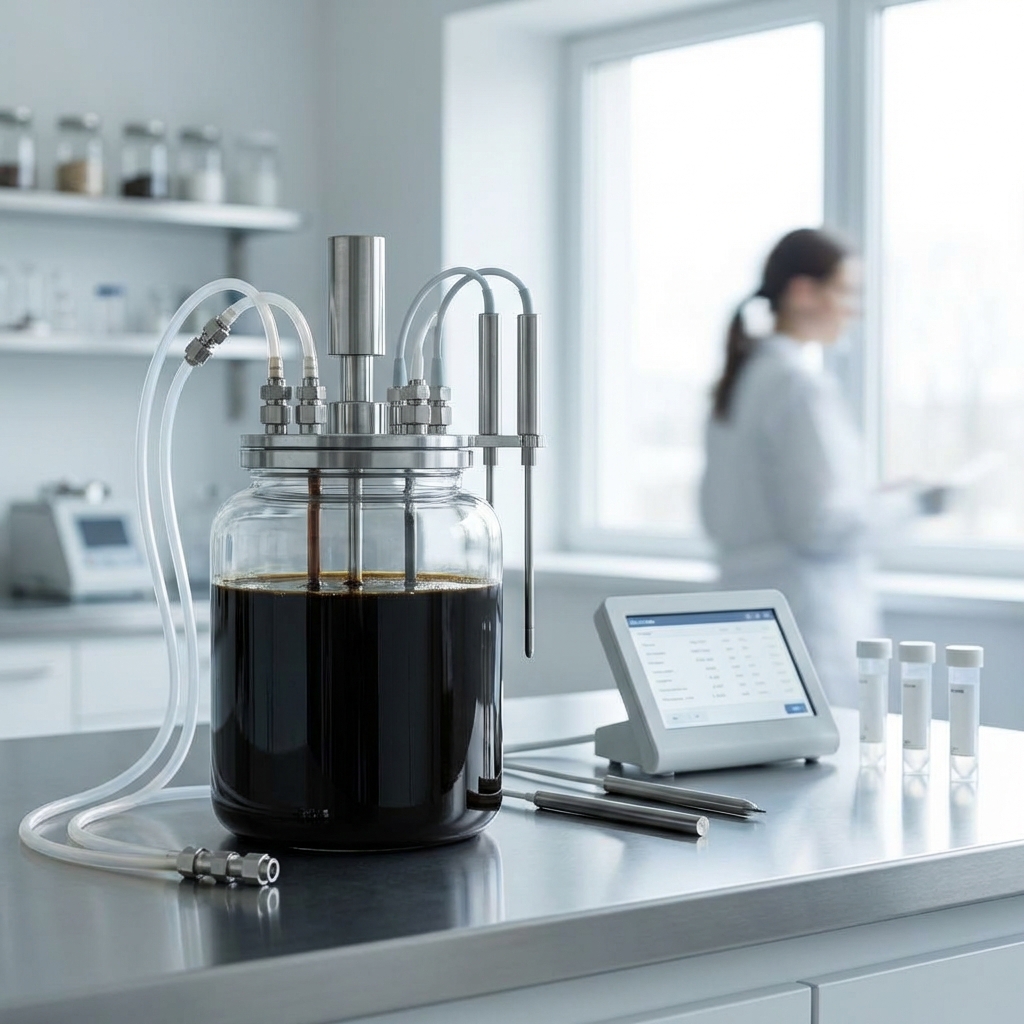
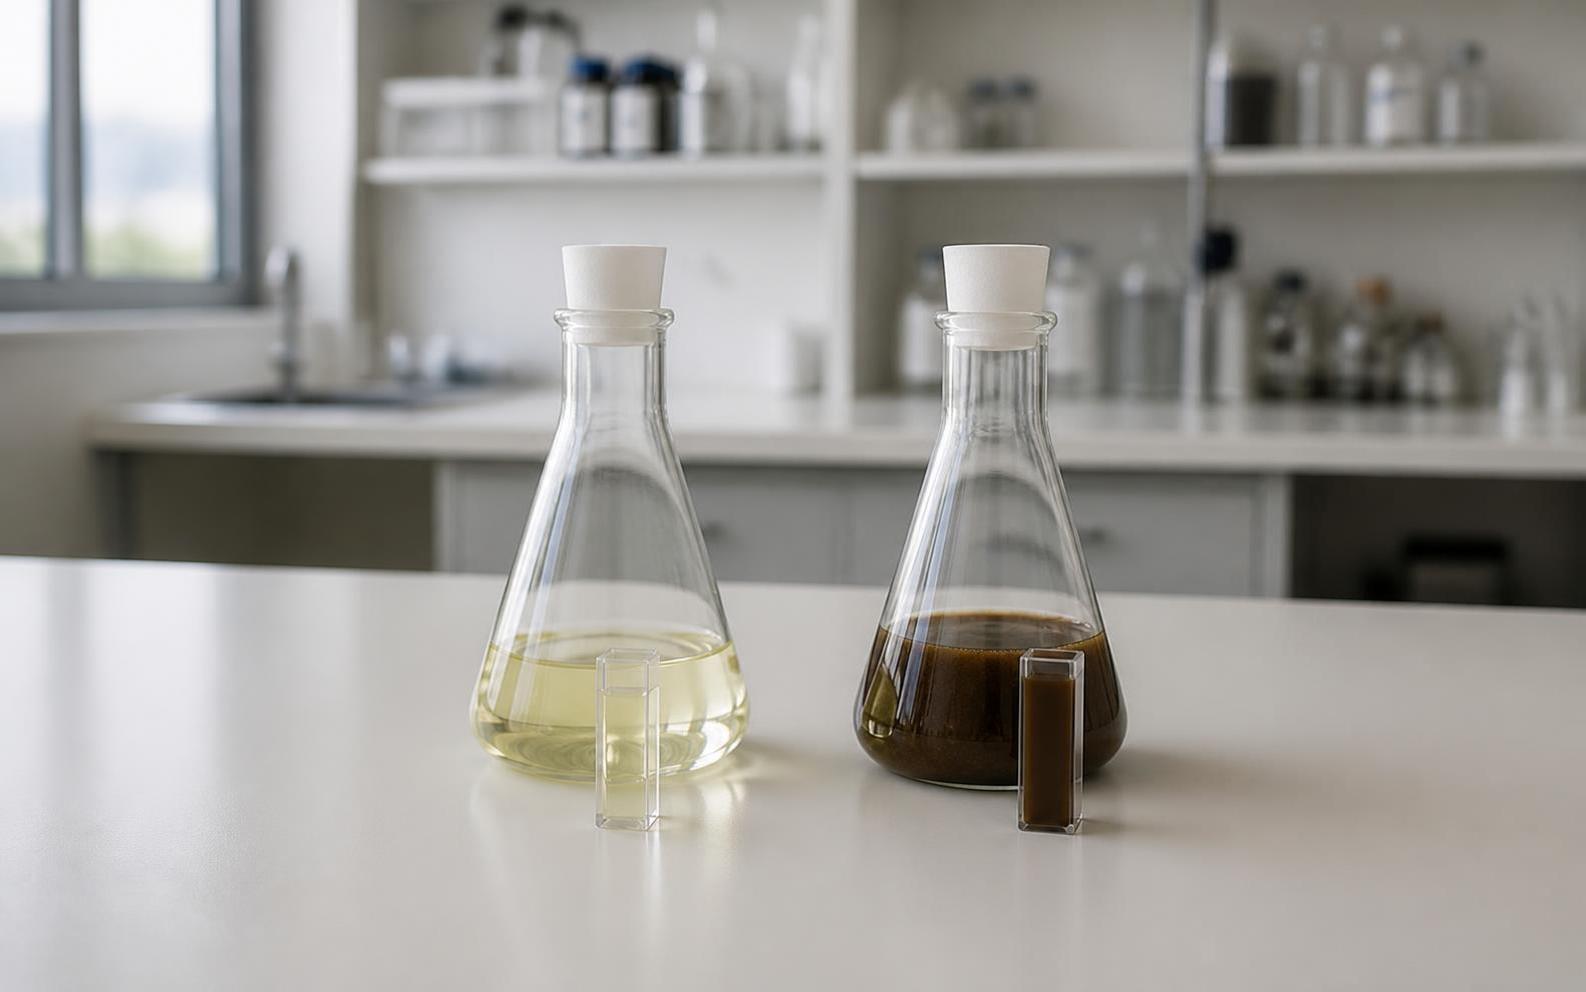
In opaque, coloured or particulate media, OD gives no usable signal. BactoBox still counts the cells.
Media that defeat optical density →From the first shortlist to the final process
Broad screening
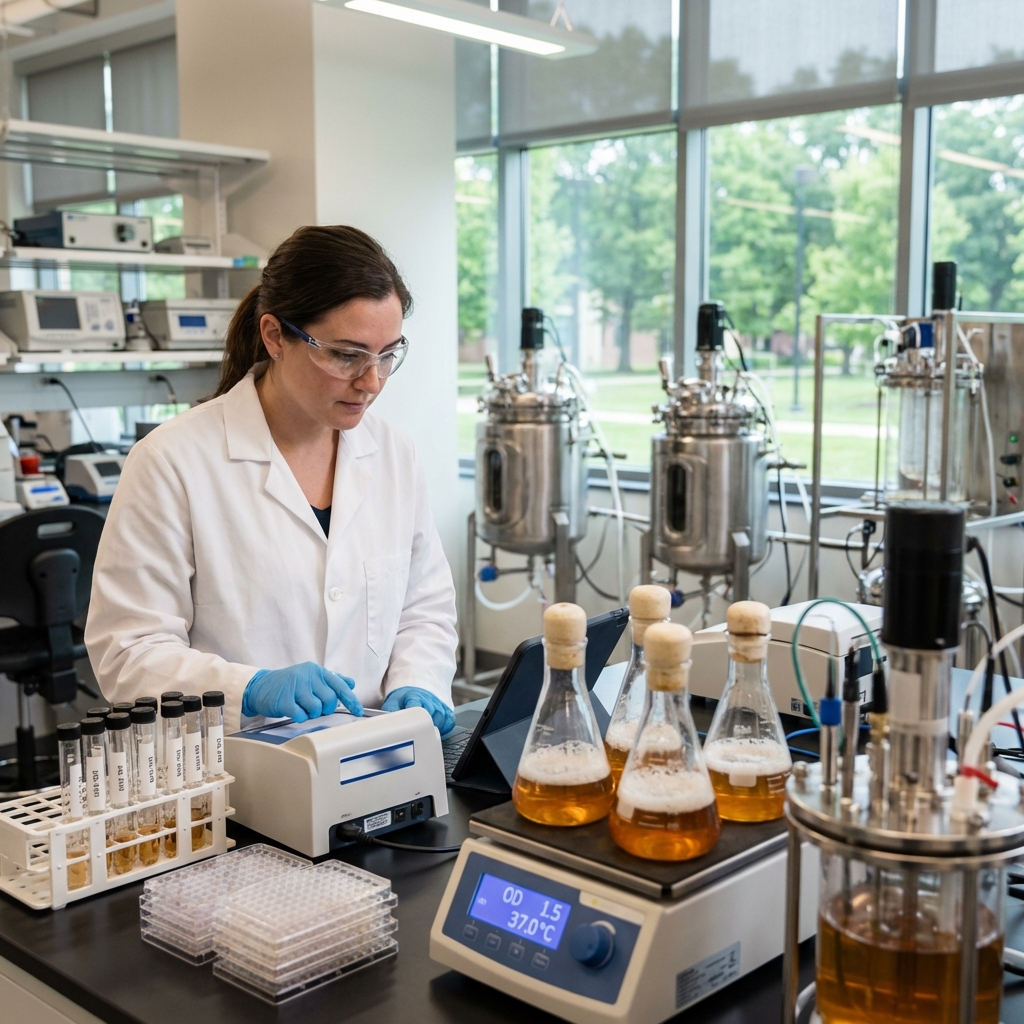
96-well plates
Shortlist comparisons
Shake flasks
Scale-up
Bioreactor
Process decisions
Harvest, induction, feed
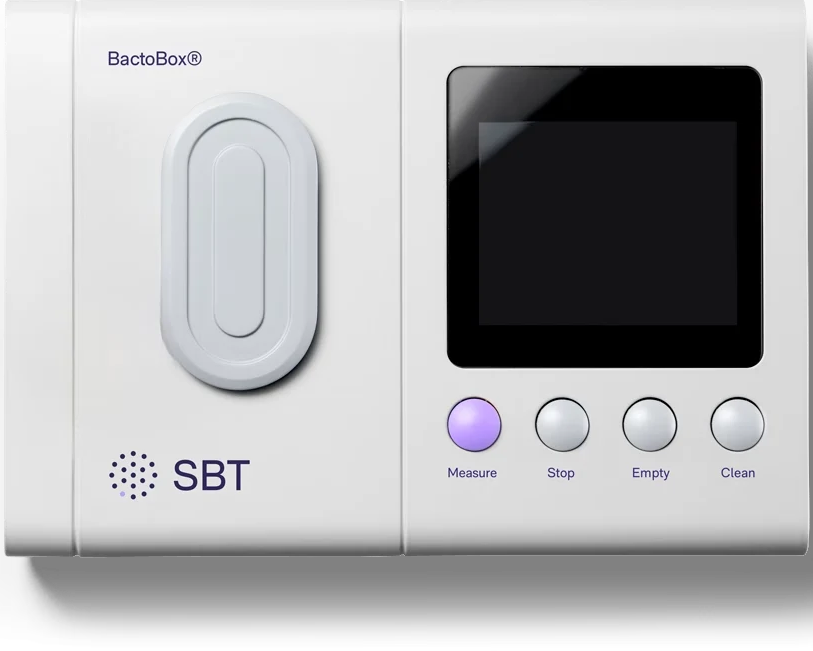
BactoBox