
When BactoBox® is introduced as a new measurement in a bacterial process development workflow, a common starting point is to take an end-of-fermentation sample and compare the cells/mL reading from BactoBox® with a CFU count from the same sample. The comparison is intuitive, but the result is easy to misread. A direct count of whole cells and a CFU count measure different properties of the population[1][2], and the relationship between them depends on where in the fermentation the sample was taken and how the sample was handled in the plating workflow.
This article walks through how to read an end-of-fermentation result. Each of the three possible outcomes — agreement, a higher BactoBox® count, or a lower BactoBox® count — reveals something about whether the process has untapped potential, recoverable yield, or counts that may be reading too low. The interpretive principles below apply to any direct count of whole cells, regardless of the method used to obtain it. For the foundational explanation of what a BactoBox® cell count is and how it compares to other enumeration methods, see Understanding BactoBox® cell counts. For the OD600 limitations that recur through this article, see Understanding OD600. For the workflow that produces a reliable cells/mL versus CFU comparison from sampling through to plate readout, see our cross-check protocol on the help center.
The article is most directly relevant to processes where the cells are themselves the product — probiotics, vaccines, biocontrol agents, seed cultures for downstream cultivation — and where a culturable or total cell count is the unit of interest. The diagnostic patterns also apply to recombinant-protein and metabolite processes when the question at hand is whether the culture is still growing, though in those processes process value also depends on titre, which is outside the scope of this article.
What the comparison should look like at end-of-fermentation
In a process designed around cell yield, the end-of-fermentation sample is typically drawn in late exponential or early stationary phase, where most whole cells are also culturable. In this window, BactoBox® and CFU track each other closely[1]. An end-of-fermentation comparison that lands in close agreement is therefore the expected outcome and a sign that the process is behaving in the expected window. When the two counts disagree, the disagreement is informative — it points either to an opportunity to recover yield, or to an issue in the analytical workflow that is hiding the true cell count.
The three patterns below describe each form of disagreement and what it suggests. In every case, OD600 is unable to act as a referee on the same sample, because OD600 responds to cell size, intracellular composition, and non-cell particulates as well as to cell number[3][4]. The same OD value is consistent with multiple states of the underlying culture, including states that imply very different conclusions about process potential.
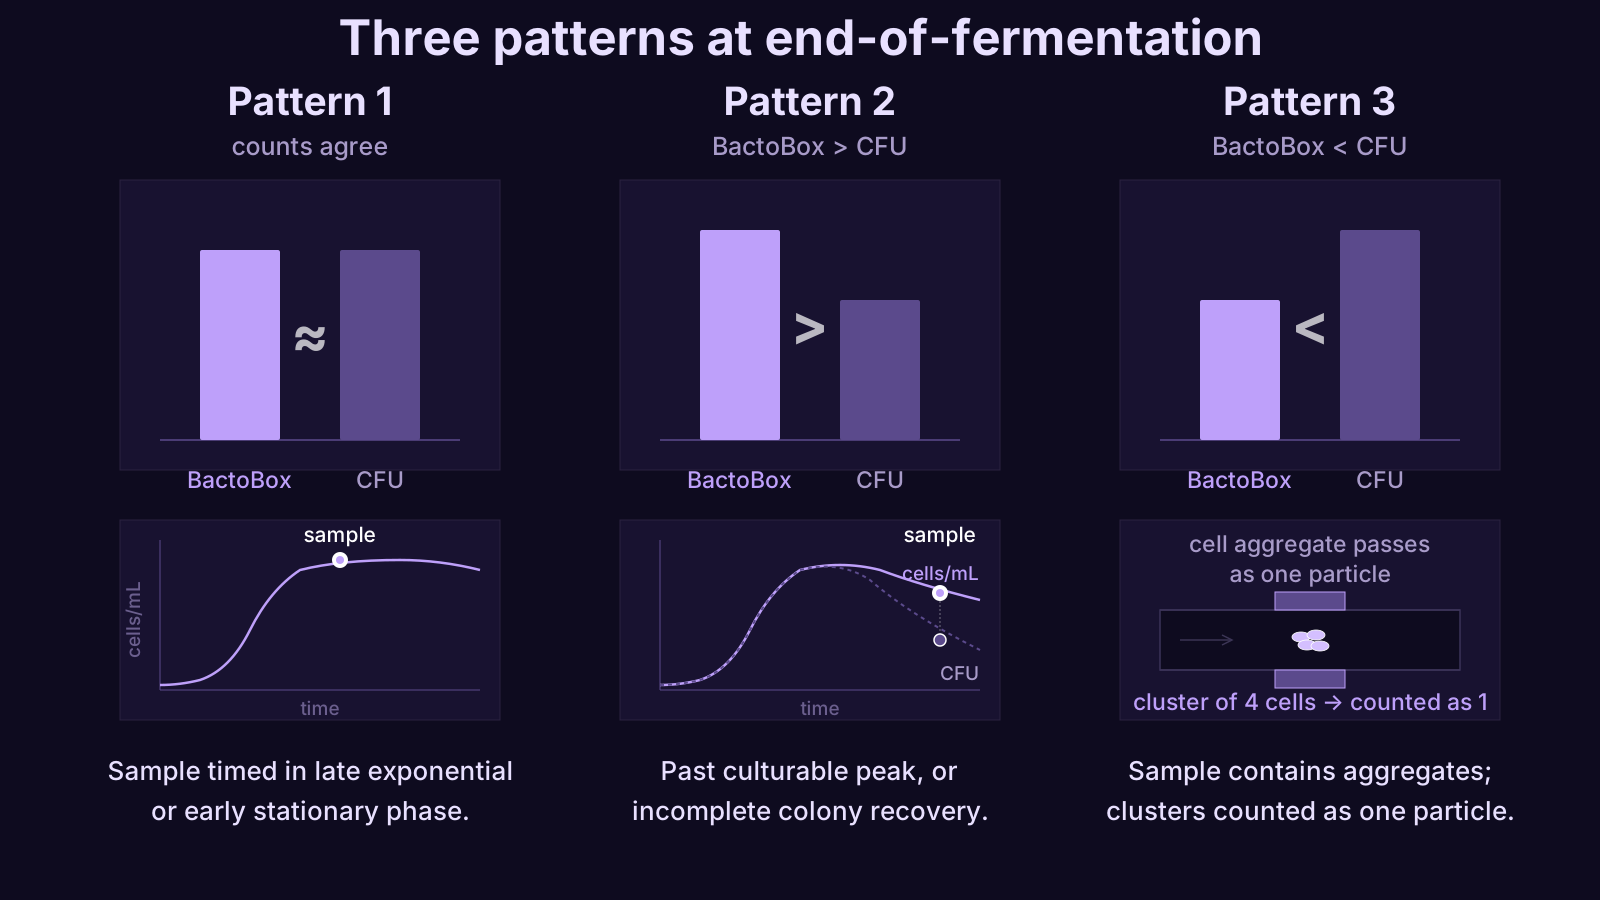
Pattern 1 — the BactoBox® count and the CFU count agree
The cells/mL reading and the CFU count are in close agreement. This is consistent with a sample taken while most cells are still culturable, typically during exponential or early stationary phase[1].
The measurement itself does not point to an immediate problem, but it does not rule out a subtler one — the culture may not yet have reached its cell-count peak at the time the sample was taken. Agreement between the two counts confirms that the sample falls in the window where they should agree, but not that it sits at the plateau. There may be more cell yield available by allowing the process to continue further. Confirming that the cell count has actually plateaued requires a sequence of measurements through the slowdown into early stationary phase.
Pattern 2 — the BactoBox® count is higher than the CFU count
The sample contains more whole cells than culturable cells. There are two distinct explanations, and both translate directly into recoverable yield.
The first explanation is that the culture has continued past the point where culturability peaks. A fraction of the cells will still be whole while no longer forming colonies on the plate. The comparison does not say whether those cells are dead or have entered a viable-but-non-culturable (VBNC) state[2], and the operational conclusion does not depend on which it is — not all cells in the sample are culturable any more. In practical terms, an earlier sampling point could yield more culturable product from the same process without changing anything else.
The second explanation is that the chosen plating technique is not recovering all culturable cells. For the same organism, pour plating, spread plating, and drop plating expose cells to different physical and thermal conditions during plating, and can give different counts on the same sample as a result. Pour plating, for example, briefly mixes cells with molten agar at approximately 45 to 50 °C, and that exposure can reduce recovery for heat-sensitive or already-stressed cells, while spread and drop plating avoid the molten-agar step entirely[5]. A useful internal check is to plate a single sample by more than one technique and compare. If the techniques disagree on a sample where they should agree, the plating workflow is contributing to the discrepancy with the direct cell count, and the gap may close once the workflow is reviewed.
The OD600 reading does not separate these two explanations from each other or from a correctly-timed sample. The discrepancy between cells/mL and CFU is doing the diagnostic work.
Pattern 3 — the BactoBox® count is lower than the CFU count
The cells/mL reading appears lower than the CFU count. At the single-cell level this is not physically possible, so the explanation lies in how the sample is presented to each method.
When cells in the sample have formed aggregates, a cluster of cells passes through the BactoBox® flow cell — the microfluidic channel where each particle is detected as a single event — as one event rather than as the several cells it contains. Larger aggregates can fall outside the detectable particle size range entirely and contribute nothing to the BactoBox® count, while still producing a single colony on a plate. On a plate, the same cluster may give rise to one colony, or the aggregate may break apart during plating and produce several[6]. In every variation, the CFU count registers more events than BactoBox® on the same sample, and a BactoBox® count lower than CFU is therefore a strong indication that the sample contains aggregates.
The downstream point worth making is that if the end product is reported in CFU, there is a meaningful risk that the CFU count is also undercounting the population, because aggregated cells that grow up as a single colony are recorded as one[6]. The cell count the process is actually producing may be higher than the CFU number suggests. Investigating whether a disaggregation step would change the result is often worthwhile. If a disaggregation step is introduced, it should be applied consistently to the samples measured by both methods for the comparison to remain meaningful.
Conclusion
A single end-of-fermentation comparison, read carefully, can already point to where yield is being left on the table or where the reported count may be misleading. Agreement between BactoBox® and CFU confirms the sample sits in a sensible window, but does not confirm it sits at the cell-count peak — there may be more cell yield available by allowing the process to continue. A BactoBox® count higher than CFU points to a culture that has passed its culturable peak or to incomplete colony recovery on the plate, both of which translate into recoverable yield. A BactoBox® count lower than CFU points to aggregation, and the cell count the process is actually producing may be higher than the CFU number suggests.
In each case, the crosscheck is an entry point. A fuller picture comes from following the cell count through the slowdown and early stationary phase.
For help interpreting a specific result on a process you are working with, reach out. Other articles in our help center cover related applications of cells/mL in fermentation development.
References
- Jordal PL, Díaz MG, Aalund F, Skands G. Performance qualification of impedance flow cytometry as a rapid in-process control proxy for colony-forming units in bacterial fermentation processes. J Microbiol Methods. 2025;238:107284. https://www.sciencedirect.com/science/article/pii/S0167701225002003
- Oliver JD. Recent findings on the viable but nonculturable state in pathogenic bacteria. FEMS Microbiol Rev. 2010;34(4):415–425. https://academic.oup.com/femsre/article/34/4/415/538375
- Stevenson K, McVey AF, Clark IBN, Swain PS, Pilizota T. General calibration of microbial growth in microplate readers. Sci Rep. 2016;6:38828. https://doi.org/10.1038/srep38828
- Mira P, Yeh P, Hall BG. Estimating microbial population data from optical density. PLoS One. 2022;17(10):e0276040. https://doi.org/10.1371/journal.pone.0276040
- Sanders ER. Aseptic laboratory techniques: plating methods. J Vis Exp. 2012;(63):e3064. https://doi.org/10.3791/3064
- Martini KM, Boddu SS, Nemenman I, Vega NM. Maximum likelihood estimators for colony-forming units. Microbiol Spectr. 2024;12(9):e03946-23. https://journals.asm.org/doi/10.1128/spectrum.03946-23