
You cannot develop a bacterial process without measuring how the culture grows. Optical density does not track growth accurately, and it cannot be used to compare one cultivation with another. Our article Nobody measures growth accurately today shows the evidence across four routine process decisions.
Growth is tracked accurately when cell count and cell size are measured separately, which is what BactoBox® enables. The count is the number you follow, because growth is cell division. Size is what makes the count trustworthy.
This article covers what BactoBox® reports, how the measurement is made, and how it compares with the methods already in the lab.
What BactoBox® measures
BactoBox® counts every whole bacterial cell in a sample, one cell at a time, and reports cells/mL and cell size. A cell that has stopped dividing is counted. A cell that no longer forms a colony is counted. A cell that takes up propidium iodide is counted. Lysis is what removes a cell from the count, because a cell that has come apart is no longer there.
A whole cell is a simple thing to define. It is either there as a closed object or it is not. What grows into a colony on a chosen medium, and what takes up a dye under chosen staining conditions, both depend on choices made in the assay, and both move when those choices move. A whole-cell count does not, which is what makes it straightforward to work with and comparable from one run to the next.
It is also the number an OD600 reading is standing in for. Growth is cell division, so counting cells is the direct version of the measurement optical density approximates. The difference is that OD600 adds cell number and cell size together, along with everything else in the light path, and never says which of them moved. BactoBox® reports the two separately, from the same measurement.
How the measurement works
BactoBox® is a benchtop instrument that counts bacterial cells one cell at a time as they pass through a microfluidic flow cell. It uses impedance flow cytometry. A pair of microelectrodes detects the way each particle perturbs an electrical field as it crosses between them,[1] and every particle within the instrument's 0.5–5 µm detection range is recorded as a single event.

Cells and particles
Each event is then classified. A bacterial cell produces the characteristic impedance signature for as long as it is a closed object with its cytoplasm inside, and as long as its size falls in the bacterial range. A cell with a damaged and permeable membrane still meets both conditions, so it is still counted as a cell. This is why a cell that stains with propidium iodide is counted.
Once a cell has lysed, its membrane fragments and its contents disperse. What is left is either below the size the instrument detects, or far enough from the signature of a whole cell that it is not classified as one. Salt crystals, antifoam droplets, insoluble medium components and other debris in the same size range are not cells either.
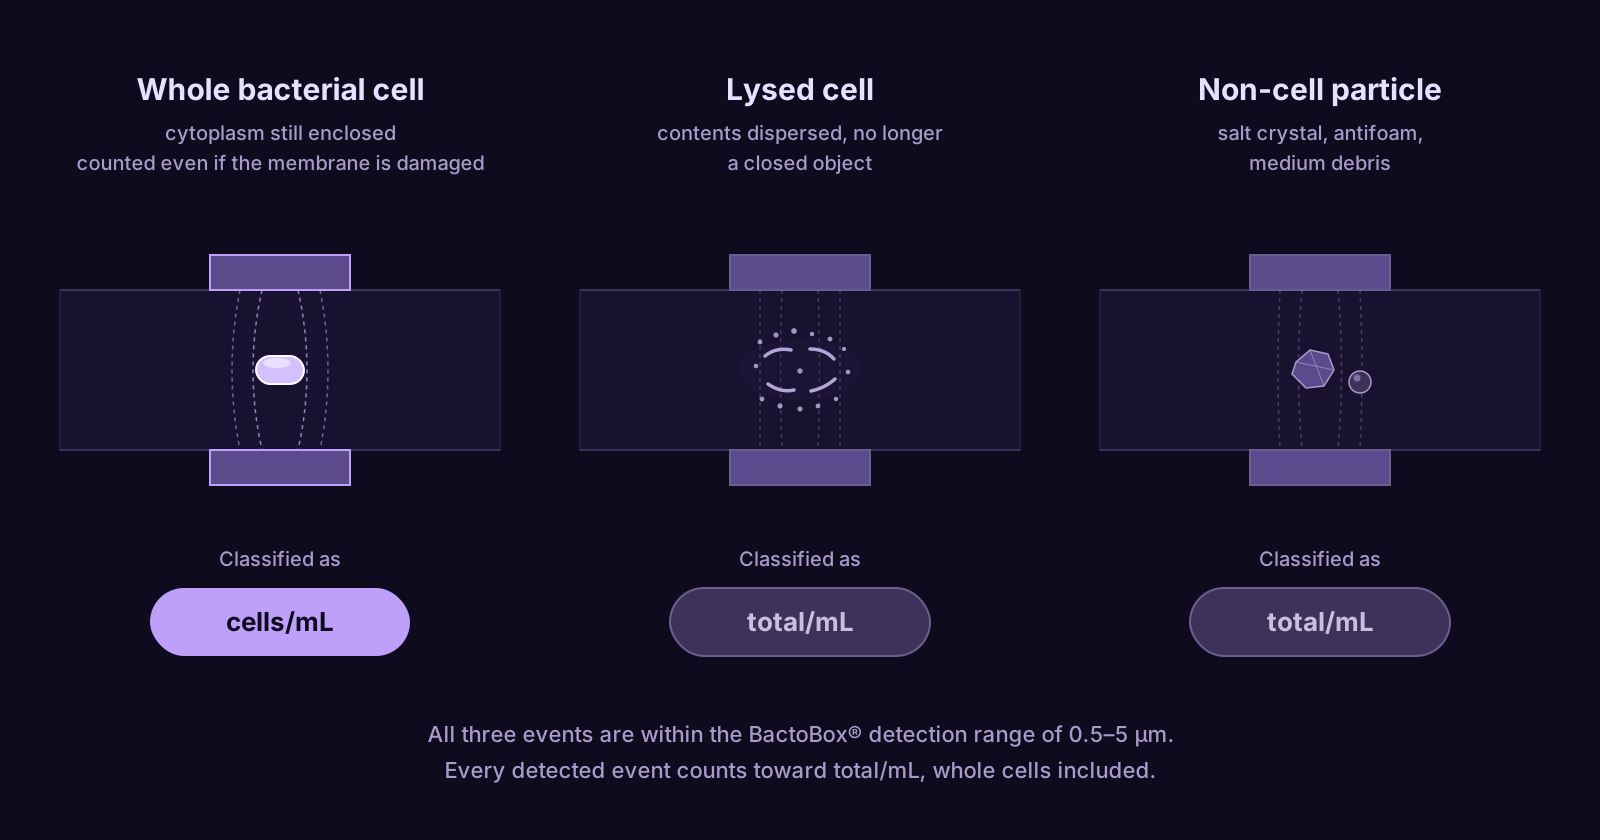
That classification is what produces two numbers from one measurement. cells/mL is the concentration of whole bacterial cells. total/mL is the concentration of every particle detected, the cells included, and the distance between the two says how much of what is in the sample is not a cell.
Being able to tell cells from particles is also what lets a direct count work in matrices that defeat optical density. OD600 sums everything in the light path and has no way to say what is a cell and what is not, so an opaque or particulate medium makes the reading uninterpretable. BactoBox® decides one particle at a time, so the cell count survives a background that OD600 cannot see through. Our article on OD600-incompatible matrices works through where this matters.
One thing follows from counting one event at a time. A doublet, a short chain or a clump of cells crosses the measurement zone as a single event, so it registers as one cell carrying a larger signature. The count runs low and the size runs high at the same time. An accurate count of an aggregating sample therefore needs a preparation step that breaks the clumps apart. We encourage users to deaggregate, and we offer an analytical service to develop tailored protocols.
Cell size
BactoBox® reports size as CIZE, the average spherical-equivalent diameter of the counted cells. This is the diameter of a sphere holding the same volume as the cell, so the number encodes a volume, and a small change in the number is a large change in size. A population at CIZE 2 µm holds roughly eight times the volume of one at CIZE 1 µm.
Size is what makes the count trustworthy. Separating cell number from cell size is the one thing an optical density reading cannot do, so reporting both is the evidence that the count is clean. Size also carries a signal of its own, and it often moves before the count does. Coming out of lag phase the count can sit flat near the seeding level while size climbs steeply, because cells build the machinery to divide before they divide. Our article on measuring bacterial cell size covers how to read it.
The default setting
These properties do not come from the hardware alone. They follow from the way SBT defines the measurement, and that definition is what BactoBox® runs on its default setting. We ship it on every instrument and we recommend it, and it is what your instrument is running unless SBT has specifically set up something else with you.
How BactoBox® compares to the methods already in the lab
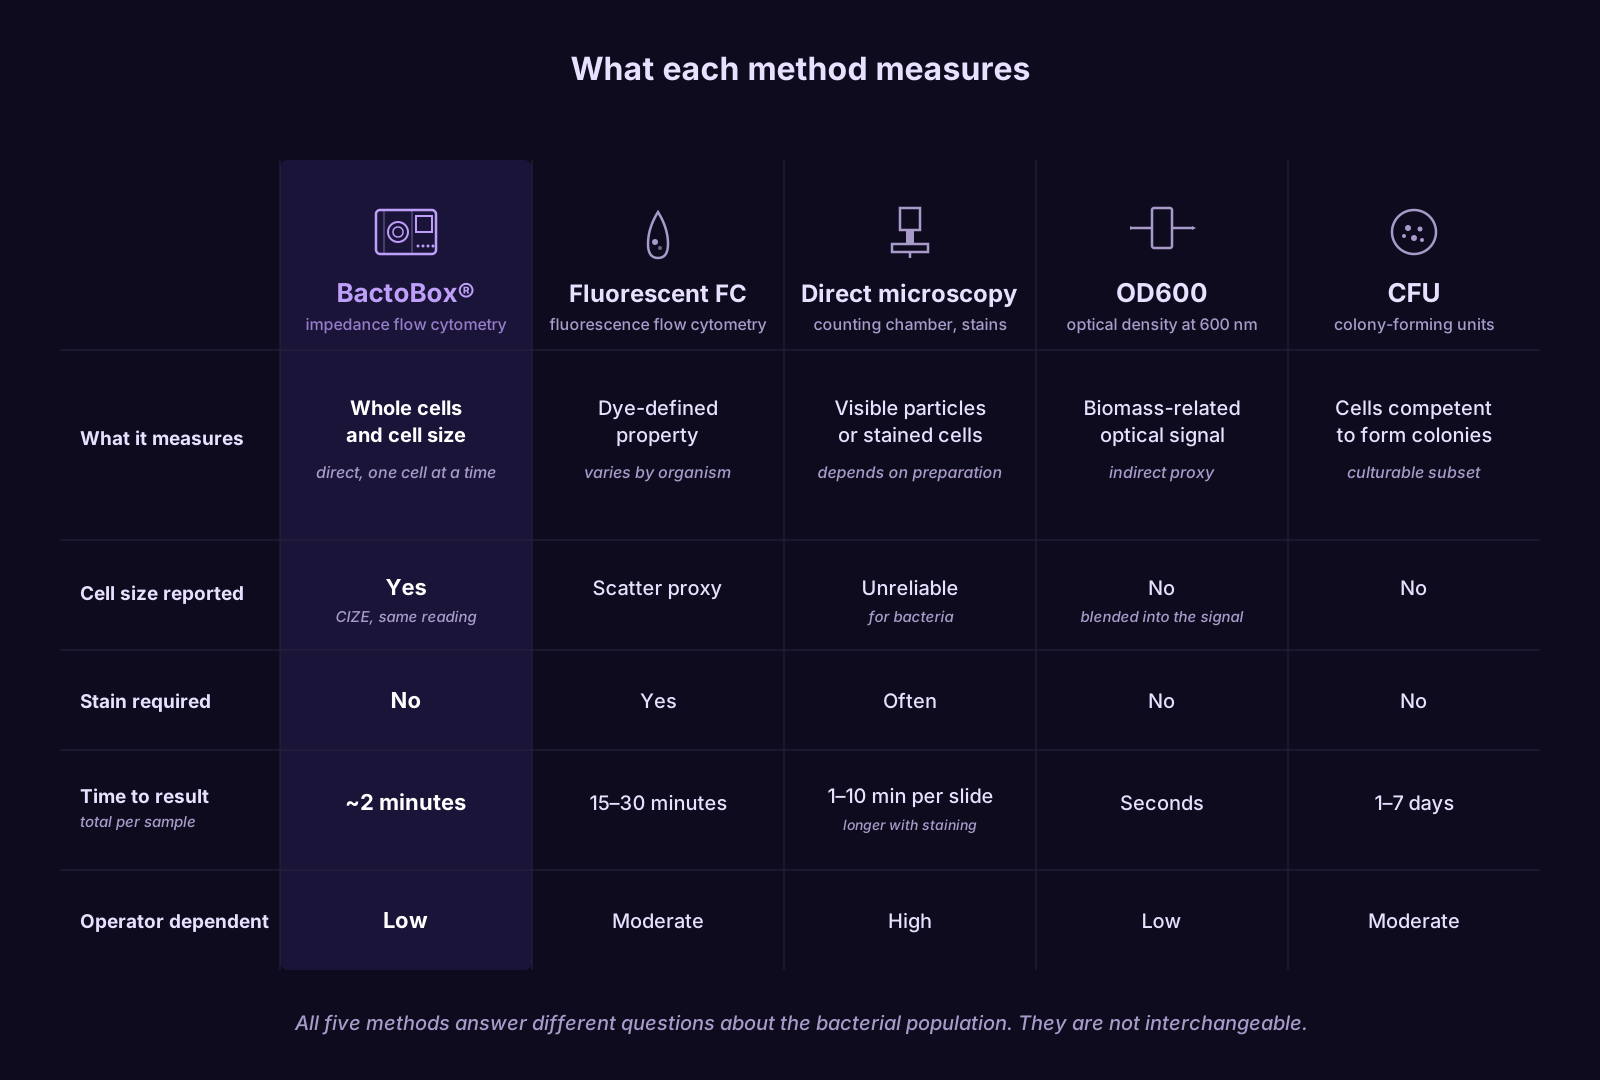
One framing that recurs through this section is worth flagging in advance. None of the methods below measure live cells. "Live" is not a property that can be tested on an individual bacterial cell without changing it, and the operational definitions in use are population-level stand-ins.[2] What these methods measure are specific, well-defined properties. Whether a cell is still whole, whether a dye can cross its membrane, whether it forms a colony on a chosen medium, and how much light a suspension scatters. These are different properties, and the differences matter.
BactoBox® and OD600
A common misconception is that BactoBox® is a different route to the same kind of signal OD600 produces. OD600 is the optical density at 600 nm read on a spectrophotometer, and it is the workhorse signal in most cultivation labs. It is not a cell count. It is a turbidity-based proxy for biomass that responds to cell number, but also to cell size, morphology, and any non-cell particulates in the light path. Two runs can sit on identical OD curves with materially different cultures behind them, and nothing in the OD data reveals it.
There are two places where OD600 remains the right tool. Within one cultivation, with the same strain, medium, vessel and instrument, it works as a fingerprint for whether a run is behaving like the last one. In early high-throughput screening, where the job is to sort out the worst performers in a plate format, it is fast, cheap and good enough. What it cannot support is a trustworthy comparison between cultivations, because changing the medium or the conditions changes the cells and moves the OD-to-cell relationship with them. Our article on understanding OD600 covers the signal, its uses and its limitations in depth.
BactoBox® and CFU
A colony-forming unit (CFU) is, operationally, a unit in the sample capable of forming a visible colony on a chosen medium under chosen conditions. CFU counts are not counts of every cell present. They are counts of cells competent to grow into a colony in that specific assay. Cells that are physically whole but have lost the ability, perhaps temporarily, to grow do not register as CFUs.[3] CFU also undercounts samples containing aggregates, because a clump of multiple cells grows up as a single colony. The arithmetic that turns colonies into a concentration assumes every cell plated produces its own countable colony, and clumping breaks that assumption.[4] CFU is sensitive to the plating workflow itself as well. Differences between pour plating and dehydrated film methods such as Petrifilm have been documented on the same samples, running in both directions depending on the organism.[5]
A BactoBox® count and a CFU count therefore measure overlapping but non-identical populations. Through exponential and early stationary phase, where most whole cells are also culturable, the two track each other closely. In work we published, a direct impedance count correlated near-perfectly with CFU across six bacterial genera.[6] The two diverge in decline phase, where cells stop forming colonies but stay counted until they lyse.
CFU measures culturability. It is not a measure of viability, though the two are routinely treated as the same thing.
BactoBox® and direct microscopy
Direct microscopy with a counting chamber such as a Petroff-Hausser or hemocytometer is the textbook reference for counting cells directly. Brightfield or phase-contrast counts measure visible particles in a small sample volume. Fluorescence microscopy with a total-DNA stain such as DAPI or acridine orange, usually after fixation or mild permeabilisation, measures cells whose DNA is accessible to the dye. Fluorescence microscopy with a membrane-integrity stain such as PI paired with SYTO 9 reports cells whose membranes have been compromised, on the same logic as the dye combination used in fluorescent flow cytometry.
The advantage no other method on this list provides is that a human can see the cells. Morphology, filament and aggregate structure, and sub-populations are all directly visible. This matters in particular for aggregating cultures, where microscopy resolves the structure that BactoBox® compresses into one event per particle. In practice, though, many labs do not use direct microscopy routinely. Throughput is slow, and the counted volume is a very small fraction of the sample. The count also depends on field selection, focus plane, and judgements about what counts as a cell. Petroff-Hausser counts of 1 µm microbeads, at bacterial size scale, have been measured 28% off the supplier's reported bead count,[7] within the chamber manufacturer's own stated 20–30% expected count discrepancy.
BactoBox® and fluorescent flow cytometry
Fluorescent flow cytometry shares its architecture with BactoBox®. Cells pass one cell at a time through a sensing region, and each one is detected as an event. The difference is what is sensed. A fluorescent instrument reads light scatter and the fluorescence of bound dyes. BactoBox® reads an electrical signal from the cell itself.
That difference decides what each one reports. The most common combination in bacterial work is propidium iodide (PI) paired with SYTO 9. PI cannot cross an undamaged bacterial membrane, so the panel sorts the population by membrane permeability.[8] The non-permeable fraction is usually reported as the intact cell count, and it is often read from there as a live cell count, even though the field has no agreed definition of a live or viable cell.[2]
Stains are also not universal, though they are often treated as though they were. Dye behaviour changes from one organism to the next. In one published comparison, SYTO 9 alone gave equal signal intensity for live and dead Staphylococcus aureus, but an eighteen-fold stronger signal for dead Pseudomonas aeruginosa than for live ones, with the same effect seen in Escherichia coli and not in the gram-positive Bacillus subtilis. The same study reports that the SYTO 9 signal bleaches strongly and decreases over time, and that maximum PI intensities are weak compared with SYTO 9 and with background.[8] A panel therefore needs assay development for the organism at hand, or at minimum careful interpretation.
BactoBox® works the other way round. No stain is added. Each object that passes the electrodes is assessed on whether its electrical properties match those of a whole bacterial cell. A cell killed by heat, oxygen or antibiotics is usually PI-positive, so it drops out of the non-permeable fraction on a flow cytometer. On its default setting, BactoBox® still counts it, because killing a cell does not necessarily break it open. That is why cells/mL tracks the total event count in a flow cytometry panel. If you are comparing BactoBox® against a fluorescence flow cytometer, compare against the total event count.
This is not a claim that a direct count is free of sample effects. Particles in the detection window still have to be told apart from cells, and aggregates still register as one event. Those show up in the data. Dye-dependent bias does not.
What direct cell counts make possible
A BactoBox® cells/mL reading is a measurement of a specific, well-defined property. It is the concentration of whole bacterial cells in the sample, and it corresponds directly to what scientists usually mean by growth, which is cell division. A direct count rises when, and only when, division actually happens.
This makes a direct cell count a must-have for growth-related measurements. A new object in the bacterial size range can only be a new cell. A specific growth rate calculated from a series of cells/mL measurements is therefore an unambiguous measurement of how fast the population is dividing. OD600 cannot say this cleanly, because increases can also come from cell elongation, morphology shifts, or storage compound accumulation. CFU is too laborious to run at the frequency that meaningful growth-rate measurements require, and its answer arrives days after the sample was taken.
Beyond growth rate, a direct count makes each phase of the growth curve more interpretable. Lag, the true exponential phase, the onset of slowdown, peak cell concentration, plateau, and lysis. Lysis shows up as a drop in cells/mL, because a cell that has come apart stops being counted.
Sequential measurements are where the value compounds. With a series of measurements through a run, the trajectory itself becomes the unit of analysis, and differences between strains, media, or runs become differences in trajectory shape rather than endpoint comparisons.
Conclusion
A direct count of whole cells is a different kind of measurement from the ones most cultivation labs have built their workflows around. It is not a faster OD600 and it is not a faster CFU. It answers the question process development turns on, and that the other routine methods cannot answer, which is the true rate at which the culture is dividing.
BactoBox® produces both numbers in about two minutes per sample, with no stain, no plate, and no manual counting step. CFU, by comparison, takes a day or more and adds variance from manual counting. The BactoBox® result is fast enough to be repeated through a cultivation, and it does not carry the operator-to-operator spread that a manual count does.
What this enables, when integrated into a process development workflow, is a clearer view of the dynamics that drive decisions at the bench. When exponential growth begins and ends, where the cell-count peak sits, when slowdown sets in, when a plateau is reached, and when lysis begins. Working from cells/mL is, at the same time, a new way of thinking about a process for many scientists. The growth curve has been read through OD600 and CFU for a generation, and re-anchoring interpretation in direct cell counts takes time.
Talk to us about your medium, organism, and workflow.
References
- Bertelsen CV, Skands GE, González Díaz M, Dimaki M, Svendsen WE. Using impedance flow cytometry for rapid viability classification of heat-treated bacteria. ACS Omega. 2023;8(8):7714-21. https://pubs.acs.org/doi/10.1021/acsomega.2c07357
- Davey HM. Life, death, and in-between: meanings and methods in microbiology. Appl Environ Microbiol. 2011;77(16):5571-6. https://journals.asm.org/doi/10.1128/aem.00744-11
- Oliver JD. Recent findings on the viable but nonculturable state in pathogenic bacteria. FEMS Microbiol Rev. 2010;34(4):415-25. https://academic.oup.com/femsre/article/34/4/415/538375
- Martini KM, Boddu SS, Nemenman I, Vega NM. Maximum likelihood estimators for colony-forming units. Microbiol Spectr. 2024;12(9):e03946-23. https://journals.asm.org/doi/10.1128/spectrum.03946-23
- Linton RH, Eisel WG, Muriana PM. Comparison of conventional plating methods and Petrifilm for the recovery of microorganisms in a ground beef processing facility. J Food Prot. 1997;60(9):1084-8. https://pubmed.ncbi.nlm.nih.gov/31207841/
- Jordal PL, Díaz MG, Aalund F, Skands G. Performance qualification of impedance flow cytometry as a rapid in-process control proxy for colony-forming units in bacterial fermentation processes. J Microbiol Methods. 2025;238:107284. https://www.sciencedirect.com/science/article/pii/S0167701225002003
- Rahman KMT, Butzin NC. Counter-on-chip for bacterial cell quantification, growth, and live-dead estimations. Sci Rep. 2024;14(1):782. https://www.nature.com/articles/s41598-023-51014-2
- Stiefel P, Schmidt-Emrich S, Maniura-Weber K, Ren Q. Critical aspects of using bacterial cell viability assays with the fluorophores SYTO9 and propidium iodide. BMC Microbiol. 2015;15:36. https://bmcmicrobiol.biomedcentral.com/articles/10.1186/s12866-015-0376-x