
The decision you make once
Most batch bioprocesses run for a long time on a single medium. The choice of medium is made early in development, and because changing it means re-validating the process, it is reviewed only periodically — typically for strains that carry a large share of production. The cost of getting it wrong is therefore not paid once. It is paid on every batch the medium runs, on every fermenter, until that review comes around.
Most of the screening work that drives this decision, across candidate media, and across the adjacent screening of process conditions, is read on OD600. Direct cell-counting methods, and CFU plating, may enter the workflow later, particularly for processes where the cells themselves are the product, or as occasional spot checks against the OD curve. The bulk of the comparison and ranking that drives the decision, however, is done on the proxy of OD600. This article is about what happens when the proxy and real cell counts disagree, and how to know which one to trust.
The OD ranking on four candidate media
In the experiment, E. coli ATCC 8739 was grown in shake flask across four candidate media: terrific broth (TB), Luria-Bertani broth (LB), tryptic soy broth (TSB), and a chemically defined medium, Bacto CD Supreme FPM (Thermo Fisher Scientific), with 10 mL/L glycerol as the carbon source. The first three are complex media; CD is chemically defined. For each medium, OD600 was tracked through a growth curve over 30 hours and the maximum value was recorded. This is a representative version of the OD-based screen most process development teams use to compare candidate media in early development.
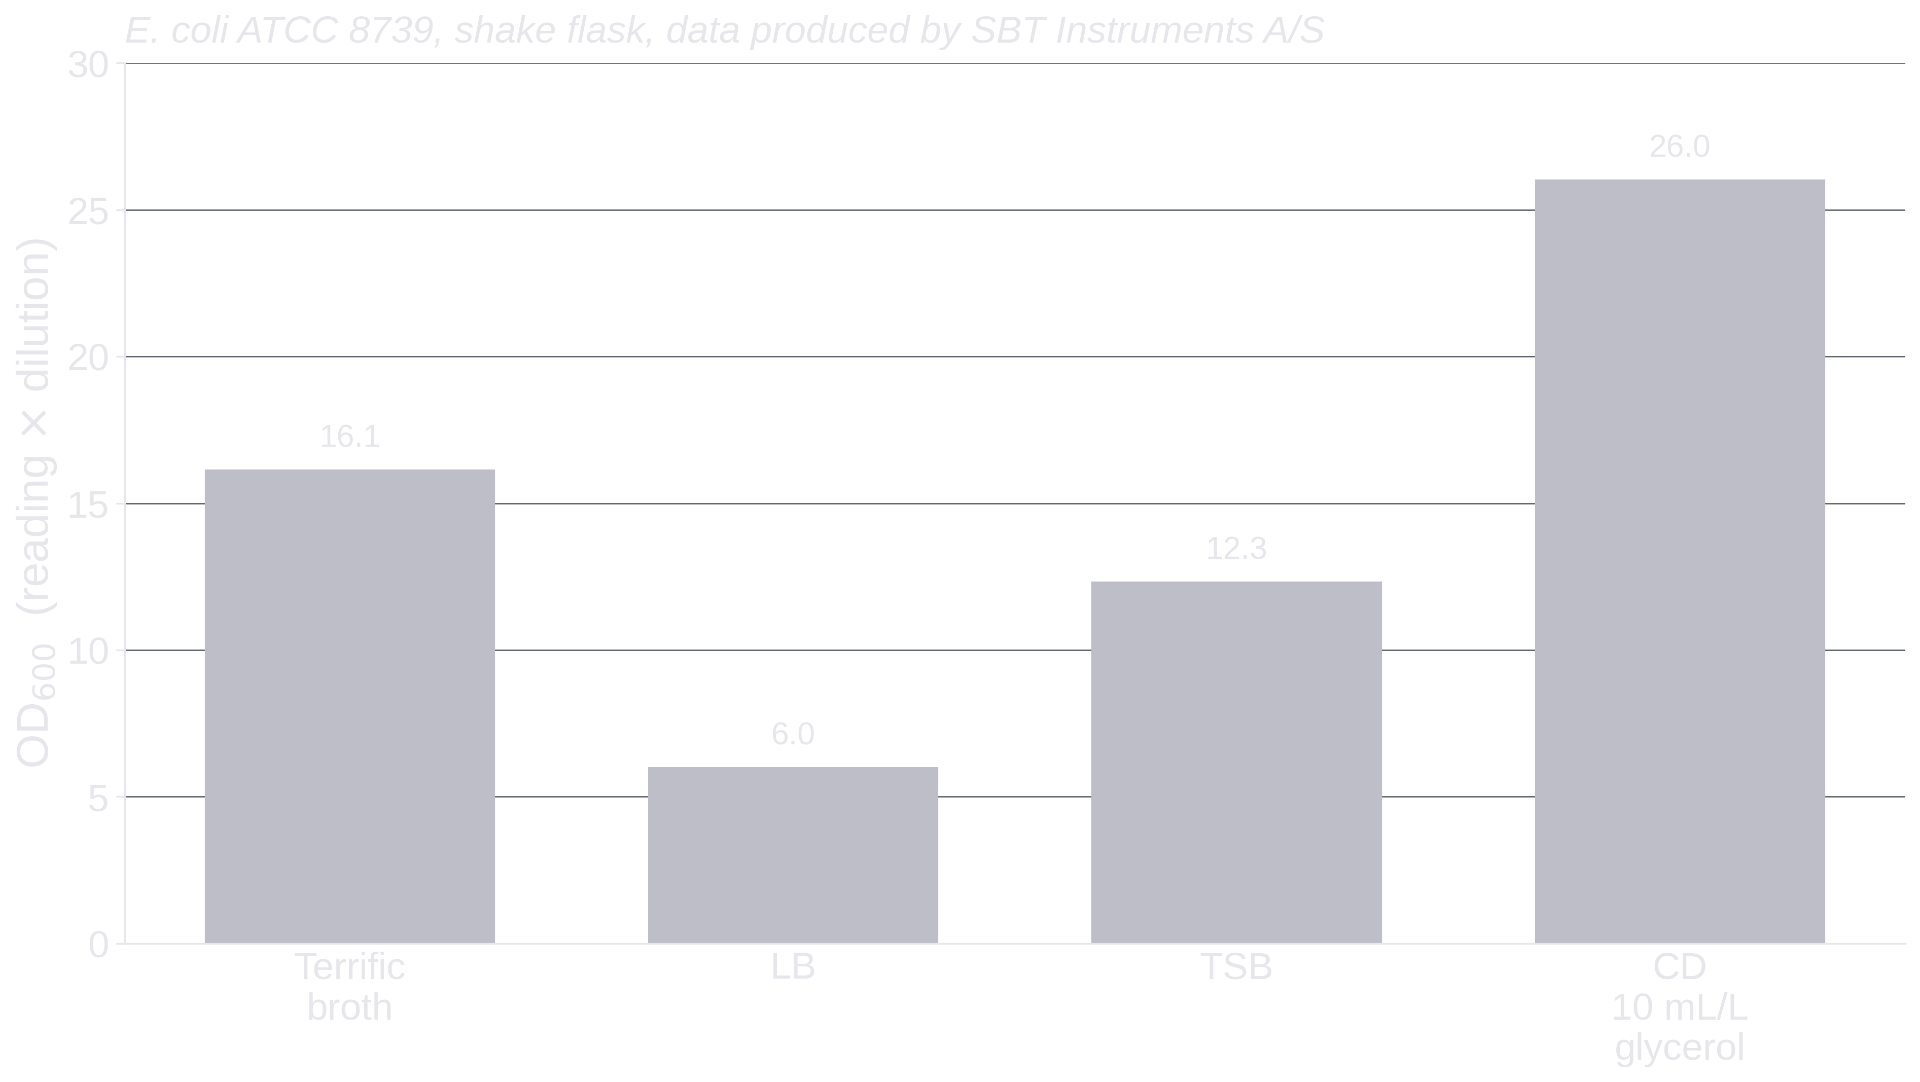
The OD ranking, best to worst, is CD, TB, TSB, LB. CD reads approximately 61% higher than TB at peak. TSB sits above LB by a smaller margin. A scientist concluding the screen on this signal alone would commit to CD for scale-up, with TB as the runner-up and LB the candidate to drop. That is the ranking the experiment produces if the only column is OD600.
The same experiment tracked direct cell counts in parallel, using BactoBox®. For more details on how BactoBox® works, see Understanding BactoBox® cell counts. BactoBox® cell counts have been benchmarked against colony-forming-unit plating across E. coli and additional bacterial species in fermentation processes, with near-perfect correlation through exponential, deceleration, and stationary phases.[1] The next plot adds those measurements alongside the OD bars on the same flasks.
The same screen with direct cell counts
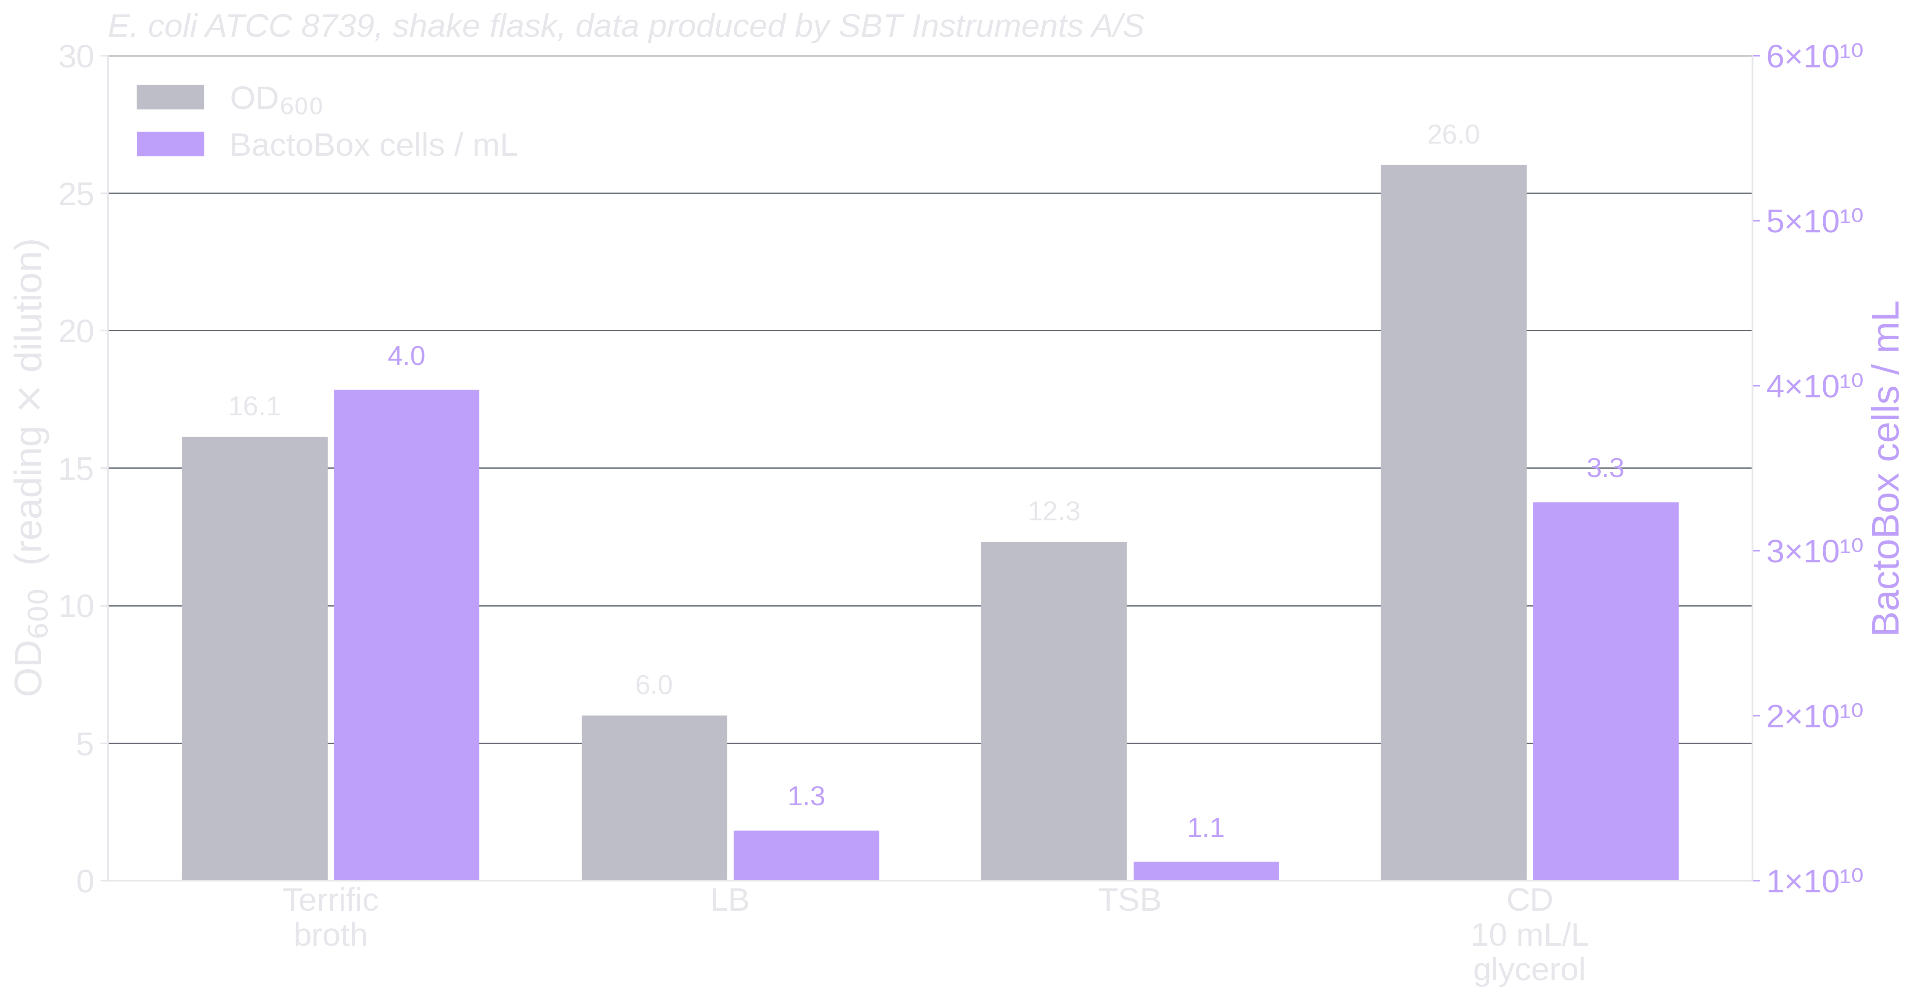
The cell-count ranking, best to worst, is TB, CD, LB, TSB. TB reaches a peak of approximately 4e10 cells/mL, roughly 21% more than CD. LB produces about 18% more cells than TSB, in the opposite order to what OD suggested.
Two rank flips appear in the same screen.
The best medium flips from CD to TB. CD reads about 61% higher than TB on OD, but produces about 17% fewer cells. A scientist screening on OD alone would carry CD forward and discard or deprioritise TB. The actual highest-concentration medium for this strain in this experiment is the one OD ranked second. A 17% gap on cells is not a marginal difference. Once a process is committed, it is 17% of cell mass per batch, on every fermenter, for as long as the process runs — a permanent loss of production capacity that an OD screen alone cannot detect.
The worst medium flips from LB to TSB. LB sits lowest on OD but produces about 18% more cells than TSB. A scientist deprioritising the lowest OD reading would deprioritise the wrong candidate. TSB, which OD placed third of four, is in fact the lowest-yielding medium of the four.
Without the cell-count column, neither rank flip is visible. The OD curves are clean, the peaks are well-defined, and the ranking is reproducible. The data passes review. The answer is wrong on two of the four ranks.
Why OD and cell counts can disagree
OD600 measures the optical scattering of a culture, and the magnitude of that scattering depends on more than the number of cells in the path. It also depends on cell size, the refractive index and density of the cytoplasm, the presence of intracellular storage compounds, and the optical properties of any non-cell particulates in the medium.[2][3] Each of these is shaped by the medium itself, which means the relationship between OD and cell count is not a constant — it is a property of the cultivation conditions.
The biology behind this is well established and is not specific to E. coli. Schaechter, Maaløe and Kjeldgaard showed in 1958 that bacterial cell size and macromolecular composition vary systematically with growth medium and temperature.[4] Volkmer and Heinemann reproduced and extended this picture in E. coli, demonstrating that cell volume and total dry mass per cell change with growth rate and conditions.[5] The same dependency has been demonstrated in Bacillus subtilis, a Gram-positive species phylogenetically distant from the enterics, where median cell length scales with nutrient availability across rich and nutrient-poor media.[6] The cells in a richer medium are not just more numerous; they are also a different size and composition than the cells in a leaner medium. The OD signal cannot separate those contributions.
Across the four media, the OD signal per cell varies by roughly threefold. No single calibration factor applied across the screen would have rescued the OD ranking, and inter-laboratory work confirms that no general OD-to-cells conversion exists even within a single organism.[2][7] For a more detailed treatment of what OD600 measures and the conditions under which it can and cannot be trusted, see Understanding OD600.
Why the disagreement is hard to catch
The disagreement between OD ranking and cell ranking is structural rather than anomalous. There is nothing in the OD data that signals an error. The curves are clean, the ranking is internally consistent, and a repeat of the experiment will return the same ranking. Each of those properties is what good data looks like, and each of them is true at the same time as the ranking being wrong.
What makes the situation difficult to recognise from inside an OD screen is precisely the absence of any internal diagnostic. There is no feature of an OD curve that flags that the cells in one flask are larger than the cells in another, or that the cytoplasmic density differs across media. A careful experiment and a sloppy experiment converge to the same ranking when both are read on the same proxy.
Why CFU spot checks are not a safety net
A reader who runs CFU plates as a verification step against the OD curve may reasonably object that this is not a problem in their workflow — the ranking is, after all, anchored against an actual cell count somewhere downstream. In practice, a CFU spot check helps only if it lands at the right moment. The culturable count in a batch cultivation rises, peaks, and often falls rapidly. A CFU sample taken before the peak, after the peak, or anywhere on the slope does not return the maximum the medium can deliver.
OD does not reliably tell you when that peak is. The same medium-induced drift in cell size and intracellular contents that distorts the cross-media ranking can also cause OD to decouple from culturable cell count, with the OD signal continuing to rise or remaining elevated after cell division has stalled.[2] A scientist relying on the OD curve to time a CFU sample may take it before or after the peak without knowing it. Plating frequently across the cultivation solves the timing problem but is operationally expensive and is not what occasional spot checks are intended to do.
The cost downstream
The cost of an OD-driven media error has a particular shape worth being explicit about. A medium, once chosen, runs every batch until the next optimisation round, and that interval is often long. A 17% under-yield on cells is not a single-experiment loss; it is 17% of fermenter throughput, batch after batch, against the fixed costs of the rest of the plant — depreciation, utilities, labour, downstream processing, and quality control. And an optimisation round still read on OD only repeats the same flawed comparison.
A process development scientist does not need to make the throughput argument at the bench. But the decision made at the bench is the input that determines throughput later. A decision grounded in cell counts is therefore made in the same units that determine throughput downstream, which avoids a translation step from a proxy that does not transfer cleanly across media in the first place.
Closing perspective
This is not an argument to abandon OD600. Within a single cultivation, where the cell properties are approximately stable, OD remains a fast and useful real-time signal to gauge if the process is running consistently. It is the comparison across cultivations on different media, or different process conditions like temperature, pH, or carbon-source level, that OD does not handle cleanly, because the cell properties OD depends on are themselves what is changing. A media ranking on OD is not a ranking on cells; it is a ranking on the product of cell number and the cell properties each medium happens to induce. Some of the time those two rankings agree, by coincidence. Often they do not.
Cells/mL at peak is also not the only input into a media decision. Growth rate, time to peak, raw-material cost, supply considerations, and — for processes whose product is a recombinant protein or a metabolite — the relationship between cell density and product titre, all matter. A complete media choice weighs them. The narrower argument made here is that when the question is which medium produces the most cells, the answer should be read on cell counts, not on OD. The same logic applies to other batch screens, including seed-train decisions; fed-batch media selection involves feed strategy and is not addressed by this analysis.
A medium chosen on cells/mL is the medium the screen was always meant to identify, in the units the decision was always meant to be made on. The expensive case — the one this article is about — is the screen where the rankings disagree and the cell-count column is missing.
References
- Jordal, P. L., Díaz, M. G., Aalund, F., & Skands, G. (2025). Performance qualification of impedance flow cytometry as a rapid in-process control proxy for colony-forming units in bacterial fermentation processes. Journal of Microbiological Methods, 238, 107284. https://doi.org/10.1016/j.mimet.2025.107284
- Stevenson, K., McVey, A. F., Clark, I. B. N., Swain, P. S., & Pilizota, T. (2016). General calibration of microbial growth in microplate readers. Scientific Reports, 6, 38828. https://doi.org/10.1038/srep38828
- Mira, P., Yeh, P., & Hall, B. G. (2022). Estimating microbial population data from optical density. PLoS ONE, 17(10), e0276040. https://doi.org/10.1371/journal.pone.0276040
- Schaechter, M., Maaløe, O., & Kjeldgaard, N. O. (1958). Dependency on medium and temperature of cell size and chemical composition during balanced growth of Salmonella typhimurium. Journal of General Microbiology, 19(3), 592–606. https://doi.org/10.1099/00221287-19-3-592
- Volkmer, B., & Heinemann, M. (2011). Condition-dependent cell volume and concentration of Escherichia coli to facilitate data conversion for systems biology modeling. PLoS ONE, 6(7), e23126. https://doi.org/10.1371/journal.pone.0023126
- Weart, R. B., Lee, A. H., Chien, A. C., Haeusser, D. P., Hill, N. S., & Levin, P. A. (2007). A metabolic sensor governing cell size in bacteria. Cell, 130(2), 335–347. https://doi.org/10.1016/j.cell.2007.05.043
- Beal, J., Farny, N. G., Haddock-Angelli, T., et al. (2020). Robust estimation of bacterial cell count from optical density. Communications Biology, 3, 512. https://doi.org/10.1038/s42003-020-01127-5