
Every batch cultivation ends with a harvest decision, and that decision determines how much product comes out of the fermenter. The processes most directly served by this article fall into two related groups.
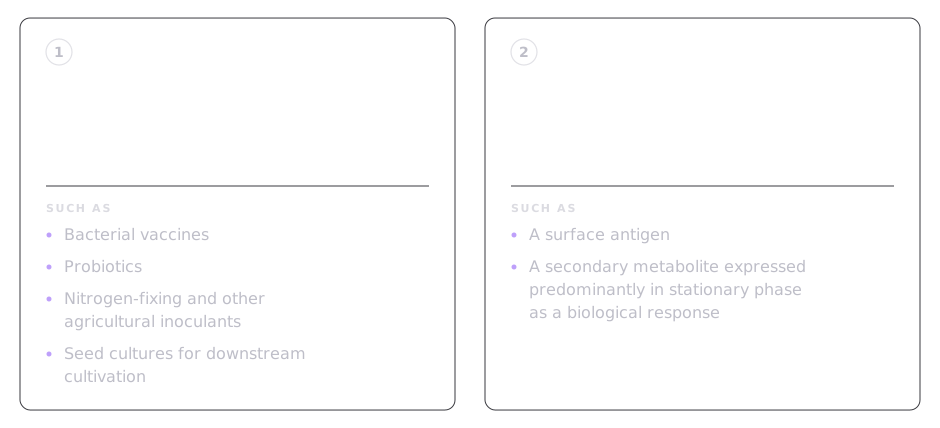
What both target groups have in common is that the harvest decision is timed relative to a single moment in the run: the transition from exponential growth into stationary phase — when cell division stops. For cell-as-product workflows this transition is the harvest target itself. Sometimes the harvest sits a defined time after the transition, and the transition is still the anchor against which that defined time is measured. In both cases, knowing precisely when the transition occurred is what makes the harvest decision rational rather than habitual.
The interpretive principles below apply to any accurate count of whole bacterial cells, regardless of the method used to obtain it. For the foundational explanation of what a BactoBox® cell count is and how it compares to other enumeration methods, see Understanding BactoBox® cell counts. For the OD600 limitations summarised below in their fuller form, see Understanding OD600.

Anchoring the harvest decision
For processes where the cells are themselves the product, the typical harvest target is the peak in culturable cell concentration, also known as the peak CFU count. Holding the run past this peak either accumulates cost in extended stationary or begins to lose culturable cells in the decline phase. Stopping the run before the peak leaves culturable product in the fermenter.
For some processes the optimal harvest sits a defined time after the transition rather than at it. The onset of stationary phase in Escherichia coli triggers a σS-dependent gene-expression program that activates dozens of genes encoding stress-response, transport, and metabolic functions[1]; the σS regulator is conserved in most γ-proteobacteria[2], and analogous stationary-phase regulatory programs operate in other bacterial groups under different alternative sigma factors. A product that accumulates as a consequence of this regulatory shift — a surface antigen whose expression turns on as cells stop dividing, a secondary metabolite that builds up during stationary phase — is best harvested some hours after the transition, not at it. The mechanism in these cases is the natural biology of stationary phase, not heterologous induction.
The same logic extends to fed-batch and cell-factory processes: even when the harvest decision is dominated by product titre, knowing the precise moment cells stopped dividing can help anchor decisions about feed-rate transitions and induction-strategy timing. The argument below focuses on the cell-as-product and stationary-phase-product cases, where the timing relationship to the cell-count trajectory is most direct.
Why OD600 cannot answer the question reliably
OD600 is a turbidity measurement, not a cell count. The signal at 600 nm is dominated by light scattering, which depends on cell size, intracellular composition, and the refractive properties of the cells in their current physiological state[3][4]. In a batch cultivation none of those properties holds still. In rich media, E. coli cell volume climbs to a maximum in early exponential growth and then falls to roughly a fifth of that peak by stationary phase[5][6], and the decline sets in before the culture leaves exponential phase[5]. The number of cells behind one unit of OD600 moves with it. Within each E. coli run in our own calibration dataset that factor climbs roughly five- to sevenfold from early growth to late exponential phase, worked through in Building an OD600-to-CFU calibration curve. OD also keeps responding to those property changes after division has slowed or stopped[3]. The OD reading drifts on the basis of cell properties rather than cell number.
In practice, when an OD curve is compared with a direct cell count on the same run, three patterns are possible.
OD plateaus before the cell count does. The OD trace flattens while cells are still dividing. A harvest called on this plateau stops the run before the transition into stationary phase is actually reached.
OD continues to climb after the cell count has plateaued. The cells stop dividing, but OD keeps rising because cell size, intracellular composition, or refractive properties continue to change. A harvest called on this plateau sits in the fermenter long after the population has stopped producing, with the run either accumulating cost in extended stationary or beginning to lose culturable cells in the decline phase. A decision intended to be timed relative to the transition — for example, a harvest at three hours into stationary phase — is also pushed late, because the reference point itself has moved.
OD plateaus at the same point the cell count plateaus. Possible, and some strains and media behave this way. Across the many runs BactoBox® users have measured, this alignment is the rare exception rather than the rule.
The practical consequence is that the moment cell division actually stops is not visible from inside an OD trace alone, and any decision timed against it inherits the OD reading's drift.
A worked example
The figure below shows an internal batch of a Pseudomonas strain, with OD600 and CFU/mL measured in triplicate at every timepoint. OD600 was read on diluted samples and adjusted back, so the trace stays inside the linear range of the instrument. The two curves are read on different axes: OD600 on the left, CFU/mL on a log axis on the right.
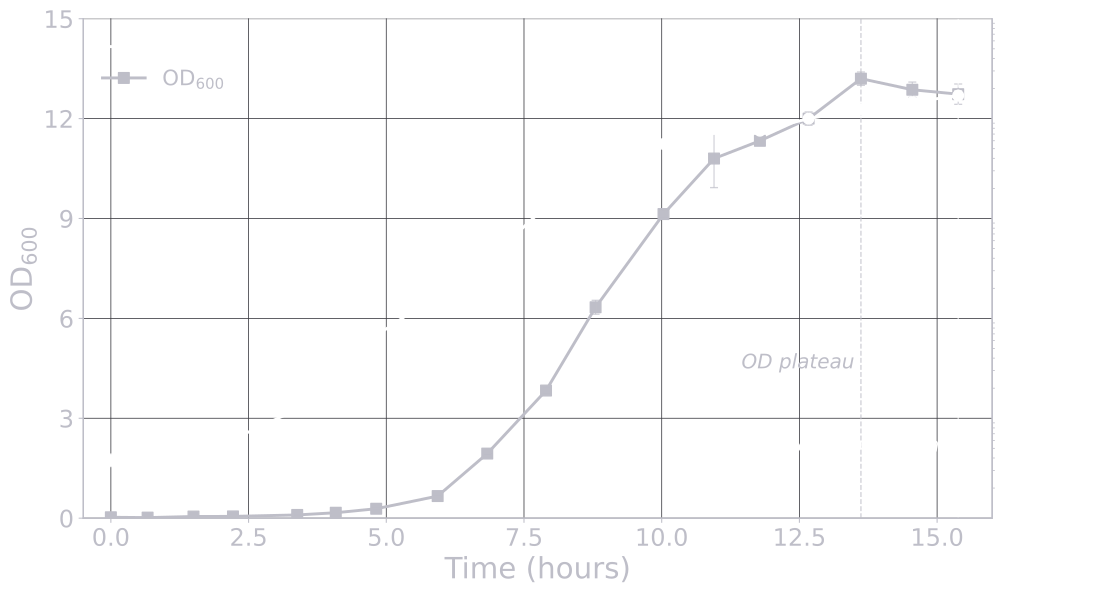
What the data shows is straightforward. The OD curve approaches a plateau at approximately 13.6 hours; from there it stays within a few percent of its maximum value for the remainder of the run. A reasonable reading of OD alone would conclude that the culture has entered stationary phase at that point. The CFU curve, taken on the same samples, says otherwise — culturable cells continue to be added for nearly two more hours. The CFU value at 15.4 hours is roughly 40% higher than the value at the OD plateau.
A harvest called on the OD signal here ends the run before the population has finished dividing. Over a production calendar, the cumulative effect of a gap of that size can be a material fraction of recoverable product, and the operator running the OD signal will never see the gap from inside the run because the OD reading itself looks like a clean stationary plateau. This is one of the three patterns described above; on a different run, the same operator might face the opposite failure mode, with OD continuing to climb after cell division has already stopped.
What a direct cell count makes possible
A direct count of cells does not carry the OD signal's interpretive ambiguity. The number rises only when new cells appear in the sample, and a sequence of measurements through the slowdown into early stationary phase shows directly when the addition of new cells stops. The cell-count plateau is the transition into stationary phase, observed in real time.
What that visibility supports is broader than a single harvest decision. For a process where the cells are the product, the plateau is the target. For a process whose product accumulates after cell division has stopped, the harvest sits a defined time after the plateau, and the timing of that defined time is now grounded in the biology rather than in elapsed time from inoculation. The shift is from harvesting against OD and hoping the proxy aligns, to harvesting against a known position relative to the moment cell division stopped — known in real time.
BactoBox counts bacterial cells in approximately two minutes per sample using impedance flow cytometry. Two minutes is short enough to make a sequence of measurements across the slowdown practical without dedicated analytical staff. The published equivalence between BactoBox and CFU is worth being explicit about. BactoBox cells/mL and CFU/mL were compared across six bacterial species spanning a range of envelope types and cell sizes, with log-log R² values between 0.9974 and 0.9998 through exponential growth, deceleration, and stationary phase, against a minimum of 0.9025 in the USP <1223> framework for alternative quantitative microbiological procedures[7][8]. Across those phases, 88% of head-to-head measurements differed by less than 0.1 log10 units[7]. The two methods diverge in the decline phase, where BactoBox continues to count whole cells that have lost culturability[7]. Through the regime where the harvest decision is actually anchored, BactoBox produces a result consistent with what a CFU plate count would produce a day or two later.
Closing
The harvest decision in a cell-as-product fermentation turns on a single question: has cell division stopped. OD600 does not answer that question reliably across runs, because the OD signal can plateau before division stops, continue to climb after division stops, and only sometimes track the cell-count plateau directly. A sequence of direct cell counts through the slowdown answers the question by measuring the thing the question is about — when new cells stop appearing in the sample.
The cell-count peak is not universally the harvest target. For products that accumulate in stationary phase, the harvest sits later; for seed-culture transfers, it sits earlier. The argument of this article is that knowing precisely when the transition into stationary phase occurred is what enables those decisions to be timed accurately, whether the harvest lands at the transition or at a defined point relative to it. The resulting decision is anchored in the dynamics of the culture rather than in a proxy whose relationship to those dynamics is not fixed.
References
- Lacour S, Landini P. SigmaS-dependent gene expression at the onset of stationary phase in Escherichia coli: function of sigmaS-dependent genes and identification of their promoter sequences. J Bacteriol. 2004;186(21):7186-95. https://journals.asm.org/doi/10.1128/jb.186.21.7186-7195.2004
- Bouillet S, Bauer TS, Gottesman S. RpoS and the bacterial general stress response. Microbiol Mol Biol Rev. 2024;88(1):e0015122. https://journals.asm.org/doi/10.1128/mmbr.00151-22
- Stevenson K, McVey AF, Clark IBN, Swain PS, Pilizota T. General calibration of microbial growth in microplate readers. Sci Rep. 2016;6:38828. https://doi.org/10.1038/srep38828
- Mira P, Yeh P, Hall BG. Estimating microbial population data from optical density. PLoS One. 2022;17(10):e0276040. https://doi.org/10.1371/journal.pone.0276040
- Åkerlund T, Nordström K, Bernander R. Analysis of cell size and DNA content in exponentially growing and stationary-phase batch cultures of Escherichia coli. J Bacteriol. 1995;177(23):6791-97. https://doi.org/10.1128/jb.177.23.6791-6797.1995
- Nieto C, Igler C, Singh A. Inferring bacterial cell size dynamics across media conditions. Sci Rep. 2026;16:9883. https://doi.org/10.1038/s41598-026-38811-1
- Jordal PL, Díaz MG, Aalund F, Skands G. Performance qualification of impedance flow cytometry as a rapid in-process control proxy for colony-forming units in bacterial fermentation processes. J Microbiol Methods. 2025;238:107284. https://doi.org/10.1016/j.mimet.2025.107284
- United States Pharmacopeia. General Chapter <1223> Validation of Alternative Microbiological Methods. USP-NF. 2021:4-6. https://doi.org/10.31003/USPNF_M9153_01_01