
Some laboratories treat a cultivation experiment as incomplete without live-dead measurements. For decline phase, that makes sense. Whether it makes sense for lag, exponential and early stationary phase comes down to one question. Can a growing culture contain dividing and dying cells at the same time?
The rule
If the cell count is rising, any cell death is negligible.
Cells slow, stop dividing, and only then die. While the count climbs, there is nothing for a live-dead measurement to add.
The rule will sound wrong to anyone who has watched optical density climb while cells died. Optical density is not a cell count. It rises with cell number, but also with cell size and with the optics of the medium. Such a run does not break the rule, because nobody was counting cells.
But negligible does not mean zero. A study that followed individual cells through growth measured a loss of about 0.05%. The rule also assumes a well-mixed, clonal culture, because a cell sitting in a dead zone does not meet the same conditions as its neighbours. And it says nothing about subpopulations that were already different, such as resistant cells or persisters under an added stressor.
This is a literature review, not a peer-reviewed study. It looked for one published dataset where the total cell count kept rising while a trustworthy viability measure fell. Nothing like it turned up.
Where the perceived need comes from
The perceived need for live-dead measurements in cultivation work usually traces back to one of two experiences.
- An optical density curve that did not explain what happened in the culture. Optical density cannot separate live from dead bacteria, so a missing live-dead capability is an easy explanation for a curve that does not add up. The real explanation is usually found in how optical density works, and Nobody measures growth accurately today shows on real cultivation data that it is a poor tracker of detailed growth dynamics.
- A live-dead staining assay that reported a growing culture as part live, part dead. Some scientists have observed this directly, others have heard it reported.
This article follows both experiences back to their sources.
Total cell counts and viability measurements
Most confusion about death in a culture comes down to which quantity is being measured[1].
The total cell count is the number of cells present. It rises while the culture grows. A cell leaves this count only when it physically comes apart, that is, when it lyses. Optical density is not a total cell count. It is a turbidity measurement.
Viability is whether a cell can still grow, given suitable conditions. It is generally measured in two ways. The first is the plate count, which more accurately measures culturability, read as colony-forming units. A cell that grows into a colony was able to divide, by definition. A cell that does not grow into a colony cannot, however, be said to be dead, because cells can enter states in which they are demonstrably alive but no longer form colonies[2]. The second common approach to measuring viability is a live-dead stain, read on a fluorescent flow cytometer or under a microscope. The common stains report membrane integrity and treat that property as a live-dead verdict. Stains for metabolic activity exist as well, though they are used less often for live-dead work.
What simultaneous growth and death would require
Before turning to the data, consider the setup. A bacterium is a simple organism, and in a homogeneous environment, meaning a well-mixed culture, every cell meets the same conditions. Is it likely that some of these identical organisms have the energy surplus to divide, while others, at the same moment and in the same conditions, are stressed to the point of death?
Division and death are both responses to conditions. In a clonal, well-mixed culture, every cell carries the same genome and meets the same temperature, pH, and nutrients at the same time. Near-identical cells in identical conditions respond near-identically. If the conditions support growth, the population grows. If the conditions turn hostile, the population slows and stops, together.
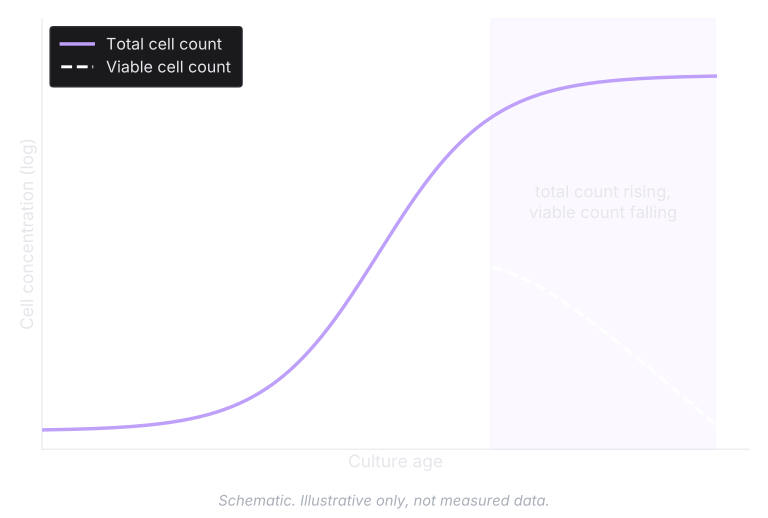
For hidden death during growth to be real, the total cell count and the viable cell count have to diverge. The total count must keep rising while the viable count falls, at the same time, in the same vessel. That is what the next sections look for, first under the stresses a cultivation produces on its own, such as self-made acid or nutrient depletion, and then under an externally applied stressor.
When the stress is the culture's own
A study that tracked individual Escherichia coli cells through growth by time-lapse microscopy recorded sixteen cells that ceased growing out of 35,049, about 0.05%, in microcolonies grown on a nutrient surface[3]. The loss during growth is negligible, though not zero. Retentostat studies, in which cells are fed so slowly that the growth rate approaches zero, used a membrane-integrity stain and reported that viability stayed high and that starvation and stress responses were largely not switched on[4][5].
The early literature answered the question differently. A 1922 study compared viable and total counts in young cultures and concluded that about 20% of the cells produced in each generation were dying[6]. A 1959 study attributed that result to the standing, unaerated cultures used at the time, and put cell death in growing cultures at considerably less than 1% per hour[7].
A deliberate search of the literature for this article has not located a single published dataset in which a total cell count rises while a trustworthy viability measure falls, in a well-mixed culture under naturally occurring stress. The strongest candidates are examined in the next section, and none holds.
Why stains report dead cells in growing cultures
Dead cells that live-dead assays report in growing cultures come from the assay rather than from the culture.
Staining assays have to be tuned to the organism, the medium, and the physiological state of the cells. The published record shows that an untuned assay misrepresents the culture in specific, documented ways, and that these failures are most pronounced in actively growing cultures.
Propidium iodide is the most common dead-cell stain, and its failure on growing cells is the best documented. A study of environmental bacteria found that up to about 40% of cells stained PI-positive during early exponential growth, in cultures whose energy charge and division rate showed them to be actively growing, against 2 to 5% in stationary phase[8]. A separate study proposed a mechanism that fits the growing state, having observed propidium ions crossing intact membranes in cells with a high membrane potential, which is the mark of an energised cell[9]. A validation study across nine species of lactic acid bacteria tested propidium iodide and rejected it, having found that heat-killed cells labelled too weakly to separate from live ones in some species, and that some untreated cells took up the dye[10].
The green counterpart of the pair is also unreliable. One study found that SYTO9 entered Gram-positive and Gram-negative species differently, and that in Pseudomonas aeruginosa dead cells gave roughly 18-fold stronger green signal than live ones[11]. A separate study applied the manufacturer's default protocol as shipped, obtained a poor fit, and concluded that a medium- and strain-specific calibration curve is required[12]. Work in oral microbiology and in microbial ecology reached the same verdict, that results have to be validated per species and per setting[13][14]. One of those surveys examined 30 studies and found that only five had carried out a validation procedure first[13].
The strongest check on a stain is a plate count taken from the same sample. A high-cell-density fed-batch study of Escherichia coli under glucose limitation ran both[15]. From 16 hours onward, while the culture was still growing, the stain reported a distinct dead population. Across that same period the culturable count kept rising and tracked the total cell count. Cells scored as dead by that stain have permeabilised membranes and cannot form colonies, so a real dead population would have opened a gap between the two counts. No gap appeared, which places the dead-labelled cells among those still forming colonies. The dead control in that study was exponentially growing cells heat-treated at 60 °C, which established that dead cells take up the dye rather than that cells taking up the dye are dead.
Three further studies come close to showing death during growth, and each fails on comparable grounds.
| Study | What kept rising | What fell | Why it does not establish death |
|---|---|---|---|
| Lactobacillus bulgaricus, pH-controlled batch[16] | the plate count, to a peak it then held for some hours | the stain-defined viable fraction, from 93% to 34% in the pH 6 culture | the 34% reading was taken after the plate count had already fallen about five-fold, so the culture was no longer growing when the low viability was recorded |
| Clostridium beijerinckii, ABE batch[17] | OD600 and the active-cell count | the CFDA/PI viability signal, to about 50% at the count peak | the fluorophore released by that stain reports intracellular pH and dims as intracellular pH falls[18]; the signal partly recovered when the pH rose again, which death does not do; no killed-cell control |
| Lactococcus lactis, batch culture[19] | the culture, through exponential phase | cells scored by cFDA/PI as an intermediate, damaged state during growth | the same study showed those cells were still culturable in exponential and stationary phase, so the staining result contradicted the stain-free measure taken alongside it |
In each case the staining result either contradicted a stain-free measure taken in the same study, was reported only once the cell count had peaked, or rested on a dye that was never validated for the conditions it was used in.
When a stressor is added
An added stressor changes the question, because the stress no longer builds up gradually. An antibiotic dosed into a growing culture arrives everywhere at once. Even then, the population does not split into a growing part and a dying part. Growth and death stay coupled.
For beta-lactam antibiotics that coupling has been measured directly. Killing tracked the growth rate across a wide range of generation times and across many antibiotic and organism combinations[20][21]. The cells that die are the ones that were growing, and cells that stop growing largely stop dying. Above the minimum inhibitory concentration a culture stops growing and then declines. A study that compared the two antibiotic classes found that a bacteriostatic reduced the initial growth rate in proportion to dose, while a bactericidal left the initial growth rate unchanged until the culture slowed abruptly[22]. In neither regime does the total count keep climbing while a substantial fraction dies.
Beta-lactams do produce an effect that can be mistaken for continued growth, because treated cells stop dividing but keep elongating into long filaments[23]. Turbidity keeps climbing while the cell number does not.
Where a population does split, the cause is a difference between the cells that was already present. In heteroresistance a resistant subpopulation is enriched while the susceptible majority is killed[24], and persisters survive because they are not growing at the normal rate[25]. Setting such subpopulations aside, the literature search behind this article found no study documenting a well-mixed clonal population whose total cell count keeps climbing while a substantial fraction is killed at the same time.
Poorly mixed vessels and mammalian cells
A poorly mixed vessel is the one setting where different cells genuinely meet different conditions, so a growth-and-death split is at least possible there. A study that ran the same Escherichia coli fed-batch at 20 m³ and at 5 L found no dying subpopulation at the large scale, where under 1% of cells were scored as dead on termination. Viability in that study was assessed by staining for membrane permeability. The poorly mixed vessel gave the lower biomass yield and the higher viability, while the well-mixed bench fermentation gave the higher yield and a viability that fell towards the end of the run. The authors described the inversion as surprising, and the dead fraction at bench scale as more difficult to explain[26]. An earlier study from the same laboratory ran a fed-batch culture in which the culturable count rose in step with the total cell count during growth, while PI staining reported a dead population in the same samples[15]. On that evidence the stain misrepresented what the culture was doing.
A live-dead assay is sometimes proposed as the way to find dead pockets, although the yield penalty is already visible in the growth rate. A whole-vessel growth rate that falls short of the same process at small scale shows that conditions in the larger vessel are not as uniform or as favourable, though it cannot say where in the vessel the problem lies.
In mammalian cell culture the difference is built into the cell. CHO and hybridoma cultures carry a dedicated cell-death pathway, apoptosis, through which an individual cell can be instructed to die[27]. Whether bacteria have an equivalent is debated, and none is established as operating in a normally growing culture[28]. The mental image many scientists bring to a bacterial culture is drawn from mammalian cell culture, and it does not transfer.
What this means in practice
The literature search behind this article supports one practical rule. While a total cell count is rising, cell death does not occur at a rate that matters. Growth and death are sequential rather than simultaneous. When conditions in a culture deteriorate, whether from self-made acid, a depleted nutrient, or an overshooting feed, cells slow and then stop dividing, and death follows after that.
How fast cells die once growth has stopped, at the end of a batch cultivation for example, is a real question. Answering it requires a viability method, either a plate count or a stain validated for the species and the conditions. At the point of growth cessation the viable count matches the total count, and only such a method shows how long that holds.
The rule assumes a homogeneous culture. In a vessel with gradients, different cells meet different conditions, and the rule says nothing about the unfavourable pockets. Finding that heterogeneity takes a different measurement, because a whole-vessel count reports the sum of whatever is growing. Cell size is one candidate, since it responds early to a nutrient shift or a change in conditions. Measuring bacterial cell size covers what cell size does and does not reveal.
All of this depends on a total cell count that can be trusted, and optical density is not one. The principle behind OD is sound, namely to follow the culture over time and read its behaviour from the trajectory. The execution is what fails. An OD reading folds cell number, cell size, and the medium's optics into one figure, and a growth rate computed from that figure inherits every one of those distortions. Understanding OD600 covers why.
What the argument needs instead is a count of whole cells, made one cell at a time. BactoBox® reports that count in cells/mL, and Understanding BactoBox® cell counts covers what the number does and does not include. Much of the field has worked without such a count, and has filled the resulting gaps with explanations such as hidden death.
If you have a dataset that breaks the rule, we would like to see it.
References
- Davey HM. Life, death, and in-between: meanings and methods in microbiology. Appl Environ Microbiol. 2011;77(16):5571-76. https://doi.org/10.1128/AEM.00744-11
- Oliver JD. Recent findings on the viable but nonculturable state in pathogenic bacteria. FEMS Microbiol Rev. 2010;34(4):415-25. https://doi.org/10.1111/j.1574-6976.2009.00200.x
- Stewart EJ, Madden R, Paul G, Taddei F. Aging and death in an organism that reproduces by morphologically symmetric division. PLoS Biol. 2005;3(2):e45. https://doi.org/10.1371/journal.pbio.0030045
- Goffin P, van de Bunt B, Giovane M, Leveau JHJ, Höppener-Ogawa S, Teusink B, Hugenholtz J. Understanding the physiology of Lactobacillus plantarum at zero growth. Mol Syst Biol. 2010;6:413. https://doi.org/10.1038/msb.2010.67
- Ercan O, Wels M, Smid EJ, Kleerebezem M. Molecular and metabolic adaptations of Lactococcus lactis at near-zero growth rates. Appl Environ Microbiol. 2015;81(1):320-31. https://doi.org/10.1128/AEM.02484-14
- Wilson GS. The proportion of viable bacteria in young cultures with especial reference to the technique employed in counting. J Bacteriol. 1922;7(4):405-46. https://doi.org/10.1128/jb.7.4.405-446.1922
- Koch AL. Death of bacteria in growing culture. J Bacteriol. 1959;77(5):623-29. https://doi.org/10.1128/jb.77.5.623-629.1959
- Shi L, Günther S, Hübschmann T, Wick LY, Harms H, Müller S. Limits of propidium iodide as a cell viability indicator for environmental bacteria. Cytometry A. 2007;71A(8):592-98. https://doi.org/10.1002/cyto.a.20402
- Kirchhoff C, Cypionka H. Propidium ion enters viable cells with high membrane potential during live-dead staining. J Microbiol Methods. 2017;142:79-82. https://doi.org/10.1016/j.mimet.2017.09.011
- Bunthof CJ, Bloemen K, Breeuwer P, Rombouts FM, Abee T. Flow cytometric assessment of viability of lactic acid bacteria. Appl Environ Microbiol. 2001;67(5):2326-35. https://doi.org/10.1128/AEM.67.5.2326-2335.2001
- Stiefel P, Schmidt-Emrich S, Maniura-Weber K, Ren Q. Critical aspects of using bacterial cell viability assays with the fluorophores SYTO9 and propidium iodide. BMC Microbiol. 2015;15:36. https://doi.org/10.1186/s12866-015-0376-x
- Robertson J, McGoverin C, Vanholsbeeck F, Swift S. Optimisation of the protocol for the LIVE/DEAD BacLight Bacterial Viability Kit for rapid determination of bacterial load. Front Microbiol. 2019;10:801. https://doi.org/10.3389/fmicb.2019.00801
- Netuschil L, Auschill TM, Sculean A, Arweiler NB. Confusion over live/dead stainings for the detection of vital microorganisms in oral biofilms — which stain is suitable? BMC Oral Health. 2014;14:2. https://doi.org/10.1186/1472-6831-14-2
- Emerson JB, Adams RI, Betancourt Román CM, et al. Schrödinger's microbes: tools for distinguishing the living from the dead in microbial ecosystems. Microbiome. 2017;5:86. https://doi.org/10.1186/s40168-017-0285-3
- Hewitt CJ, Nebe-von-Caron G, Nienow AW, McFarlane CM. Use of multi-staining flow cytometry to characterise the physiological state of Escherichia coli W3110 in high cell density fed-batch cultures. Biotechnol Bioeng. 1999;63(6):705-11. https://doi.org/10.1002/(SICI)1097-0290(19990620)63:6%3C705::AID-BIT8%3E3.0.CO;2-M
- Rault A, Bouix M, Béal C. Fermentation pH influences the physiological-state dynamics of Lactobacillus bulgaricus CFL1 during pH-controlled culture. Appl Environ Microbiol. 2009;75(13):4374-81. https://doi.org/10.1128/AEM.02725-08
- Branska B, Pechacova Z, Kolek J, Vasylkivska M, Patakova P. Flow cytometry analysis of Clostridium beijerinckii NRRL B-598 populations exhibiting different phenotypes induced by changes in cultivation conditions. Biotechnol Biofuels. 2018;11:99. https://doi.org/10.1186/s13068-018-1096-x
- Breeuwer P, Drocourt J-L, Rombouts FM, Abee T. A novel method for continuous determination of the intracellular pH in bacteria with the internally conjugated fluorescent probe 5(and 6-)carboxyfluorescein succinimidyl ester. Appl Environ Microbiol. 1996;62(1):178-83. https://doi.org/10.1128/aem.62.1.178-183.1996
- El Arbi A, Ghorbal S, Delacroix-Buchet A, Bouix M. Assessment of the dynamics of the physiological states of Lactococcus lactis ssp. cremoris SK11 during growth by flow cytometry. J Appl Microbiol. 2011;111(5):1205-11. https://doi.org/10.1111/j.1365-2672.2011.05114.x
- Tuomanen E, Cozens R, Tosch W, Zak O, Tomasz A. The rate of killing of Escherichia coli by β-lactam antibiotics is strictly proportional to the rate of bacterial growth. J Gen Microbiol. 1986;132(5):1297-304. https://doi.org/10.1099/00221287-132-5-1297
- Lee AJ, Wang S, Meredith HR, Zhuang B, Dai Z, You L. Robust, linear correlations between growth rates and β-lactam-mediated lysis rates. Proc Natl Acad Sci USA. 2018;115(16):4069-74. https://doi.org/10.1073/pnas.1719504115
- Vaisbourd E, Glass DS, Yang Y, Mayo A, Bren A, Alon U. Principles of bacteriostatic and bactericidal antibiotics at subinhibitory concentrations. mBio. 2025;16(11):e02066-25. https://doi.org/10.1128/mbio.02066-25
- Kjeldsen TSB, Sommer MOA, Olsen JE. Extended spectrum β-lactamase-producing Escherichia coli forms filaments as an initial response to cefotaxime treatment. BMC Microbiol. 2015;15:63. https://doi.org/10.1186/s12866-015-0399-3
- Andersson DI, Nicoloff H, Hjort K. Mechanisms and clinical relevance of bacterial heteroresistance. Nat Rev Microbiol. 2019;17(8):479-96. https://doi.org/10.1038/s41579-019-0218-1
- Balaban NQ, Merrin J, Chait R, Kowalik L, Leibler S. Bacterial persistence as a phenotypic switch. Science. 2004;305(5690):1622-25. https://doi.org/10.1126/science.1099390
- Hewitt CJ, Nebe-Von Caron G, Axelsson B, McFarlane CM, Nienow AW. Studies related to the scale-up of high-cell-density E. coli fed-batch fermentations using multiparameter flow cytometry: effect of a changing microenvironment with respect to glucose and dissolved oxygen concentration. Biotechnol Bioeng. 2000;70(4):381-90. https://doi.org/10.1002/1097-0290(20001120)70:4%3C381::AID-BIT3%3E3.0.CO;2-0
- Krampe B, Al-Rubeai M. Cell death in mammalian cell culture: molecular mechanisms and cell line engineering strategies. Cytotechnology. 2010;62(3):175-88. https://doi.org/10.1007/s10616-010-9274-0
- Bayles KW. Bacterial programmed cell death: making sense of a paradox. Nat Rev Microbiol. 2014;12(1):63-69. https://doi.org/10.1038/nrmicro3136