
Almost every lab working with bacteria tracks growth on optical density, and it has been this way for decades. Optical density cannot reliably compare one cultivation with another. This article is the evidence, on real cultivation data. For what the optical density number contains and why it behaves this way, see Understanding OD600.
The findings, in short. One E. coli strain was grown in four media and was tracked with both OD600 and BactoBox® direct cell counts. Four process interpretations made on OD600 were then checked against the real cell counts, and every one of them came out wrong. Inducing at a fixed OD600 would not have started expression from the same number of cells. A 4-hour reading severely misjudged how far each culture had come. Ranking the cell densities in a media screen on optical density picked the wrong best and the wrong worst. And the OD600 plateau was not a reliable marker of where growth stopped.
How optical density gets every decision wrong
Process understanding is built on questions asked about different process parameters through optical density. Induce at OD600 = 0.6, compare resulting titers. Compare the growth at 4 hours. Rank candidate media on the optical density they reach. Conclude the process when the growth curve plateaus. Every one of these treats the optical density curve as if it were the culture itself.
To investigate this assumption, one E. coli strain was grown in four media, all inoculated at the same time and density from one starter culture, then tracked in parallel with OD600 and direct cell counts through BactoBox® (see Understanding BactoBox® cell counts).
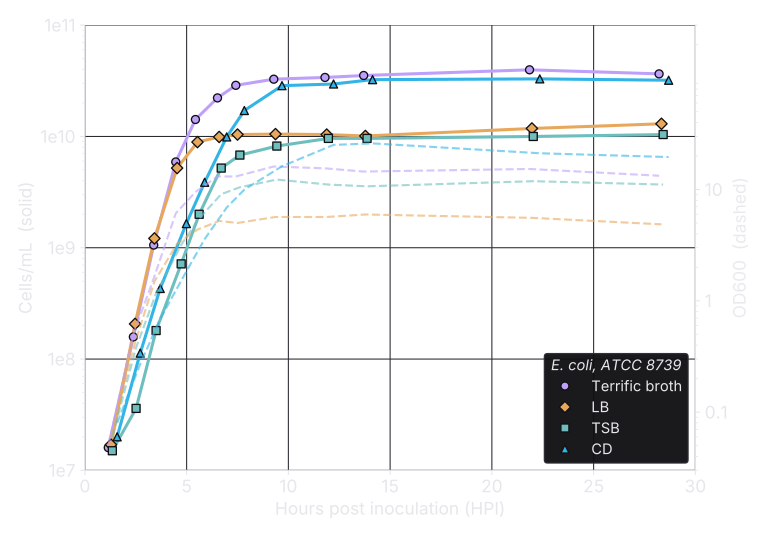
Table 1 holds the four conclusions side by side. Each question then has its own section below, with the numbers behind it.
| The question | Answered on OD600 | Answered on direct counts |
|---|---|---|
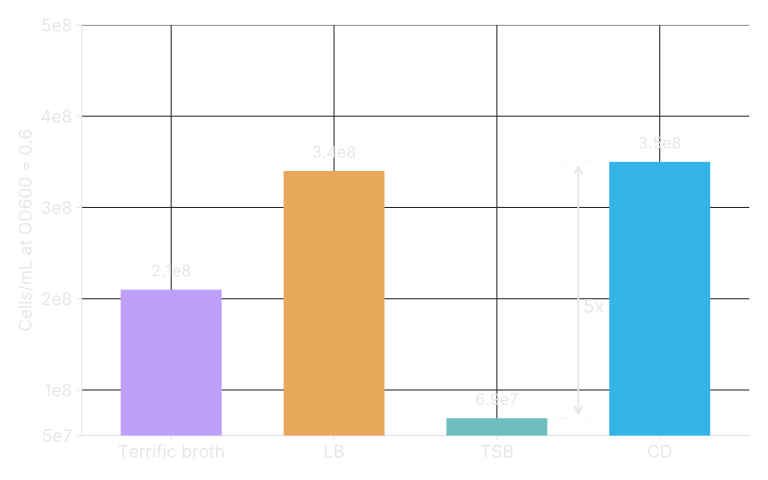
| For induction, is OD600 = 0.6 always the same culture? | By definition, yes | No. 6.9e7 to 3.5e8 cells/mL, a fivefold spread in actual cells |
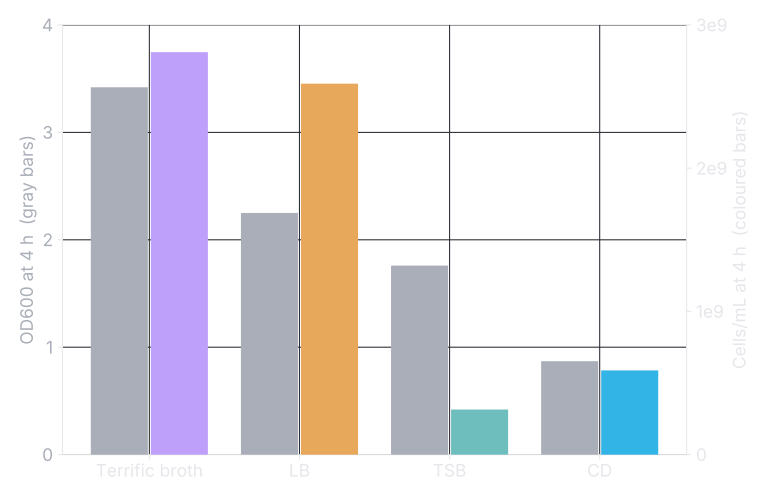
| How far has each culture come at 4 hours? | Terrific broth ahead of LB; TSB just behind LB; CD far behind | Terrific broth and LB level; LB holds 8x TSB's cells; CD ahead of TSB |
| Which medium reaches the highest cell density? | CD first, LB last | Terrific broth first, TSB last |
| When to conclude the process? | At the OD plateau | Hours away in three of four media, in both directions (Table 3) |
Table 1. What a lab would conclude on each signal. The OD600 answers mislead on all four questions.
For induction, is OD600 = 0.6 always the same culture?
When inducing protein expression at one fixed protocol point of OD600 = 0.6, the resulting cell concentration is anything between 6.9e7 and 3.5e8 cells/mL. Cell size, measured on the same samples, explains it. At OD600 = 0.6, the TSB cells averaged a Cell-Impedance-derived siZe Estimate (CIZE) of 1.9 µm against 1.4 to 1.7 µm in the other media, and a larger cell scatters more light, so fewer cells are needed to reach the same optical density. Induce every condition at the same OD600, and each one starts producing from a different number of cells. The titers measured afterwards are then not comparable, and the screen does not find the optimal process.
How far has each culture come at 4 hours?
At 4 hours, terrific broth read OD 3.4 against LB's 2.2, while the two were level on cells. LB and TSB read OD 2.2 and 1.8 while LB held 8x as many cells, and CD read 49% of TSB's optical density while holding almost 2x the cells. On the optical density column, a condition growing far behind raises no flag, and a condition growing well gets no credit.
Which medium reaches the highest cell density?
Once high-throughput screening has removed the weak candidates, the next screen compares a shortlist of media on the cell density they reach. Measured with OD600, CD reaches the highest and LB the lowest. Read on the direct counts, terrific broth reaches the highest at the end of the run, and TSB the lowest. Conclusively, optical density ranks both ends wrong. CD reads 47% above terrific broth on optical density while holding 12% fewer cells, and TSB reads 2.3 times LB's optical density while holding 20% fewer cells. A higher optical density is not a higher cell density, because optical density moves with how the cells grow, and each medium grows them differently. An optical density screen carries the wrong medium forward and drops the wrong one. The full case is worked through in Screen growth media.
| Medium | OD600 at end of run | Cells/mL at end of run |
|---|---|---|
| Terrific broth | 13.3 (2) | 3.7e10 (1) |
| LB | 4.9 (4) | 1.3e10 (3) |
| TSB | 11.1 (3) | 1.0e10 (4) |
| CD | 19.6 (1) | 3.2e10 (2) |
Table 2. The cell density each medium reached, read both ways, at the last sample within the 30-hour window in Figure 1. Parentheses rank the four media within each column.
When to conclude the process?
A common rule concludes a process when the optical density curve plateaus, for instance when the rise between two consecutive samples falls under 10%. Table 3 applies that rule to the dataset on OD600 and on cells/mL. In terrific broth, optical density flattens at 7.4 hours, and the real cell count reaches its plateau 4.4 hours later with 18% more cells. In CD the miss reverses. The cell count plateaus at 12.2 hours while optical density still climbs 56%, so the rule runs the process 1.9 hours longer than the cells support. The optical density plateau and the growth plateau are different events, and nothing in the optical density curve says how far apart they are, or in which direction.
| Medium | OD600 plateau | Cell-count plateau | Difference |
|---|---|---|---|
| Terrific broth | 7.4 h | 11.8 h | OD concludes 4.4 h early; 18% more cells at the count plateau |
| LB | 7.5 h | 7.5 h | Same sample |
| TSB | 12.0 h | 13.9 h | OD concludes 1.9 h early; the count is the same at both points |
| CD | 14.1 h | 12.2 h | OD concludes 1.9 h late; the count had already plateaued |
Table 3. The plateau rule, a rise under 10% between consecutive samples, applied to OD600 and to cells/mL on the curves in Figure 1. Trigger times are read at the sampled points, so their resolution is limited by the sampling intervals.
Every optical density reading behind these four answers is clean and reproducible, and nothing in them warns you that the conclusions are off.
Closing perspective
The two places where optical density earns its keep are real. Within one unchanged cultivation it tells you whether the run behaves like the last one, and in a first plate-format screen it sorts out the worst performers fast.
You can develop a bioprocess on optical density, and the field has done so for decades. But the cost comes in two parts and should not be underestimated. In development, inaccurate growth data makes the work harder and more frustrating. Conclusions need more runs, and some of them are wrong without looking wrong. And whatever leaves development is run in production again and again. A suboptimal process produces less product, or spends more equipment time, on every run. Optical density is easy to run and close to free per sample. The cost of what it does not measure compounds for as long as the process lives.
Nothing here is specific to media. Change any process condition, temperature, pH, feed, and the cells change with it, so optical density shifts in a direction the reading cannot reveal, and the clear view of the process goes with it. This page shows one experiment. There is more data behind the same claim, including on fed-batch processes, and we are happy to walk through it if you reach out.